 11
11peptides
spectra
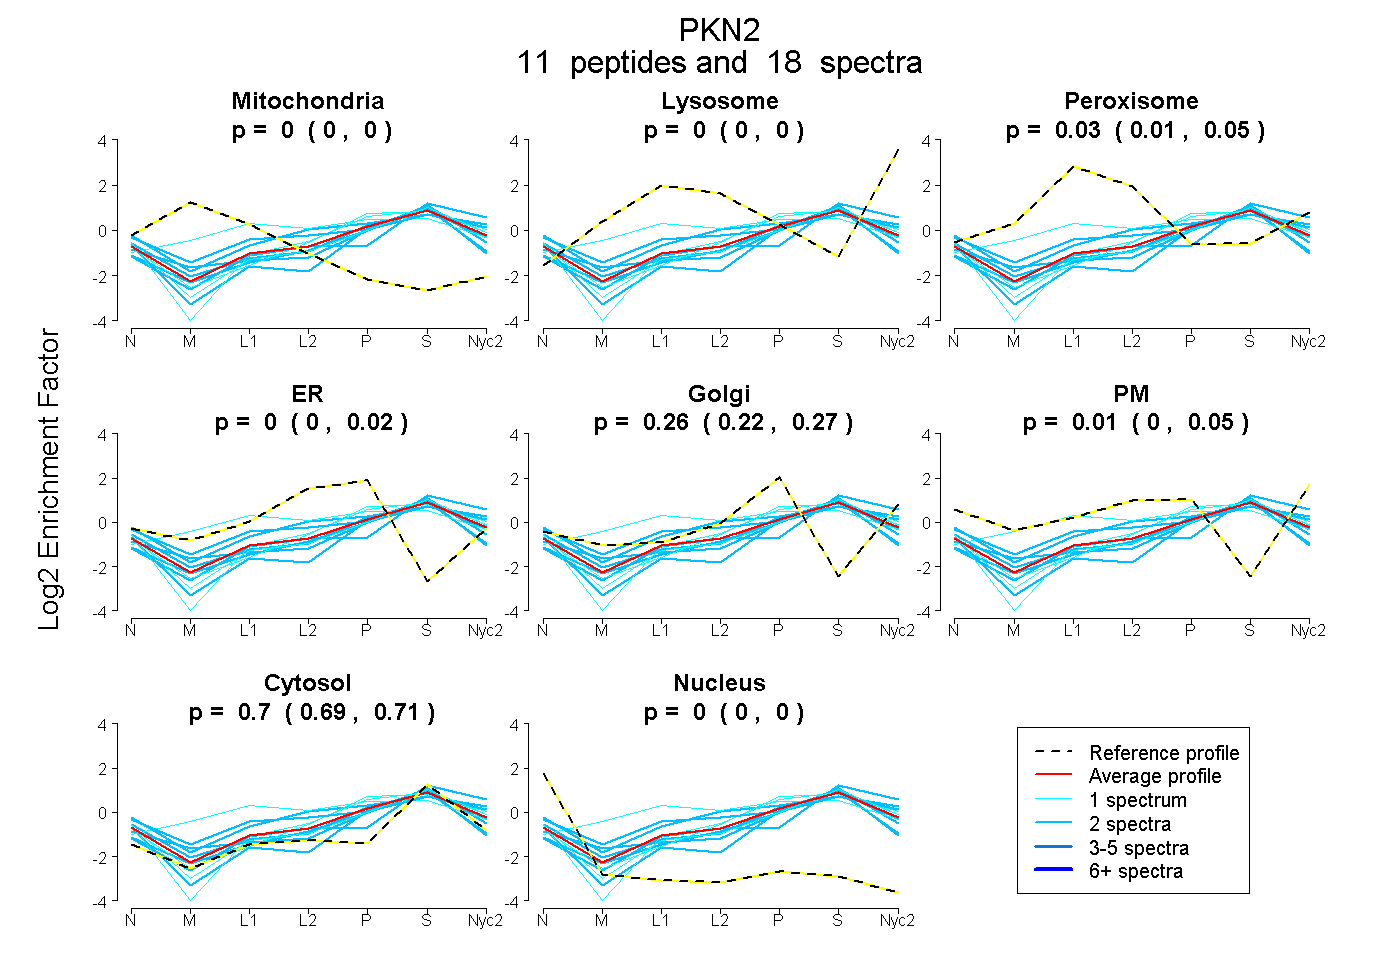
0.000 | 0.000
0.000 | 0.004
0.006 | 0.046
0.000 | 0.019
0.218 | 0.273
0.000 | 0.046
0.687 | 0.711
0.000 | 0.000
1peptide
spectrum
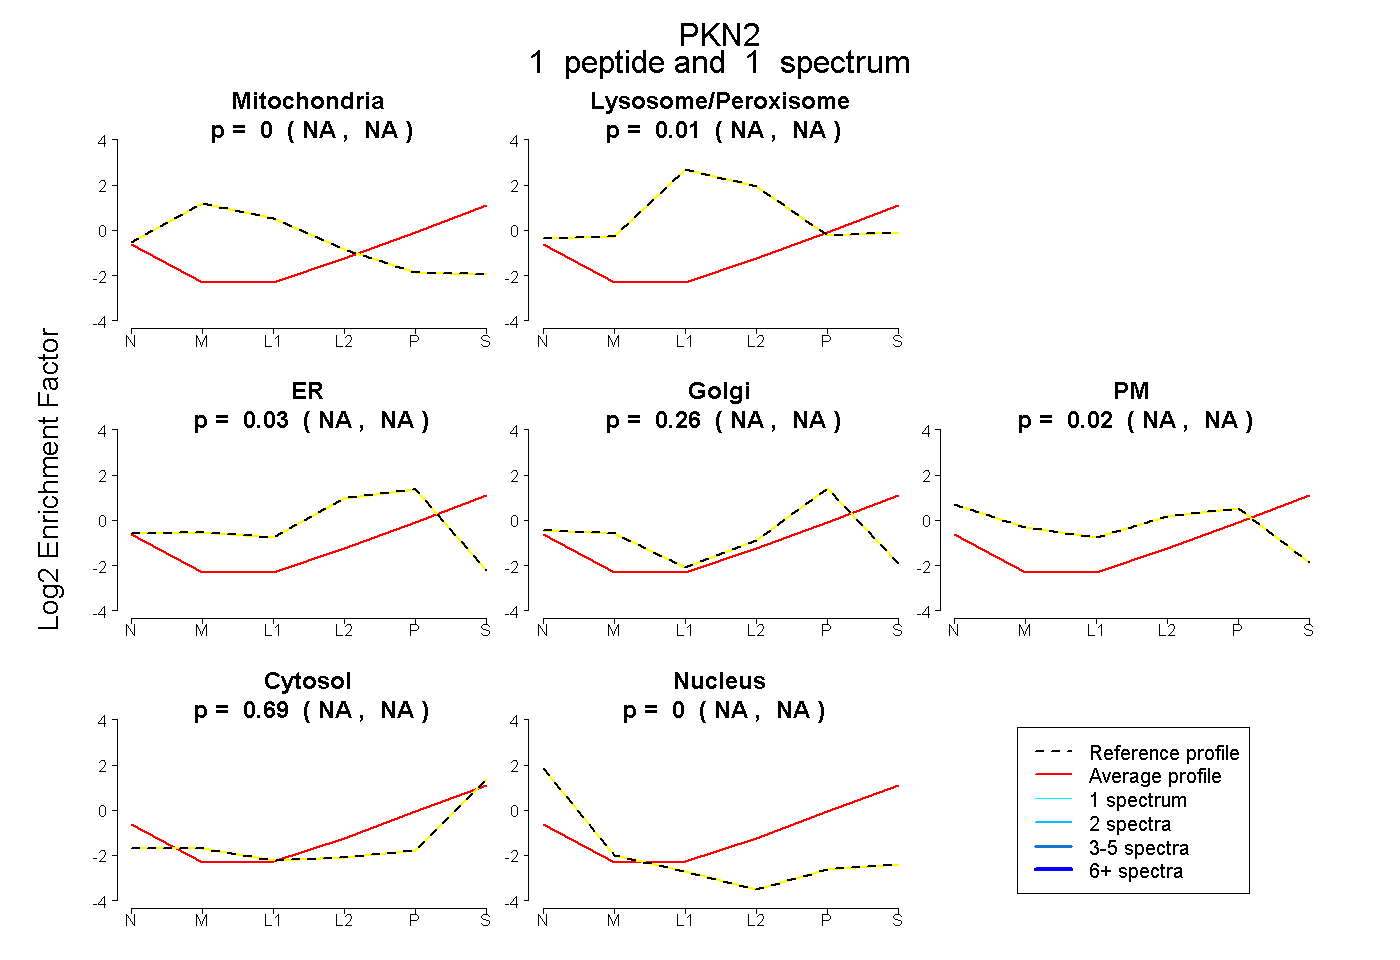
NA | NA
NA | NA
NA | NA
NA | NA
NA | NA
NA | NA
NA | NA
5peptides
spectra
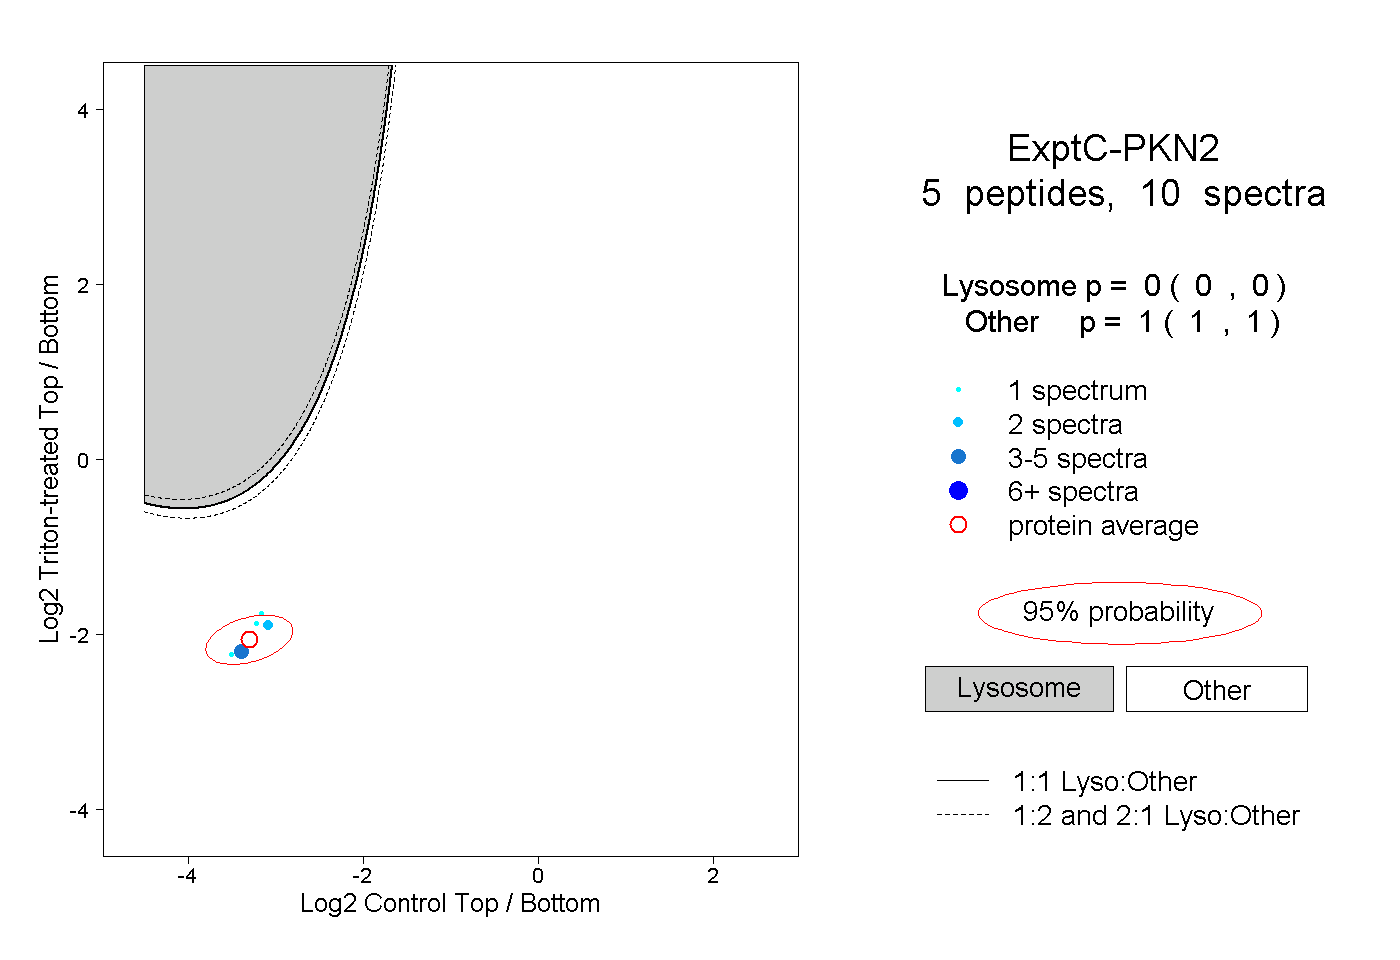
0.000 | 0.000
1.000 | 1.000
1peptide
spectrum
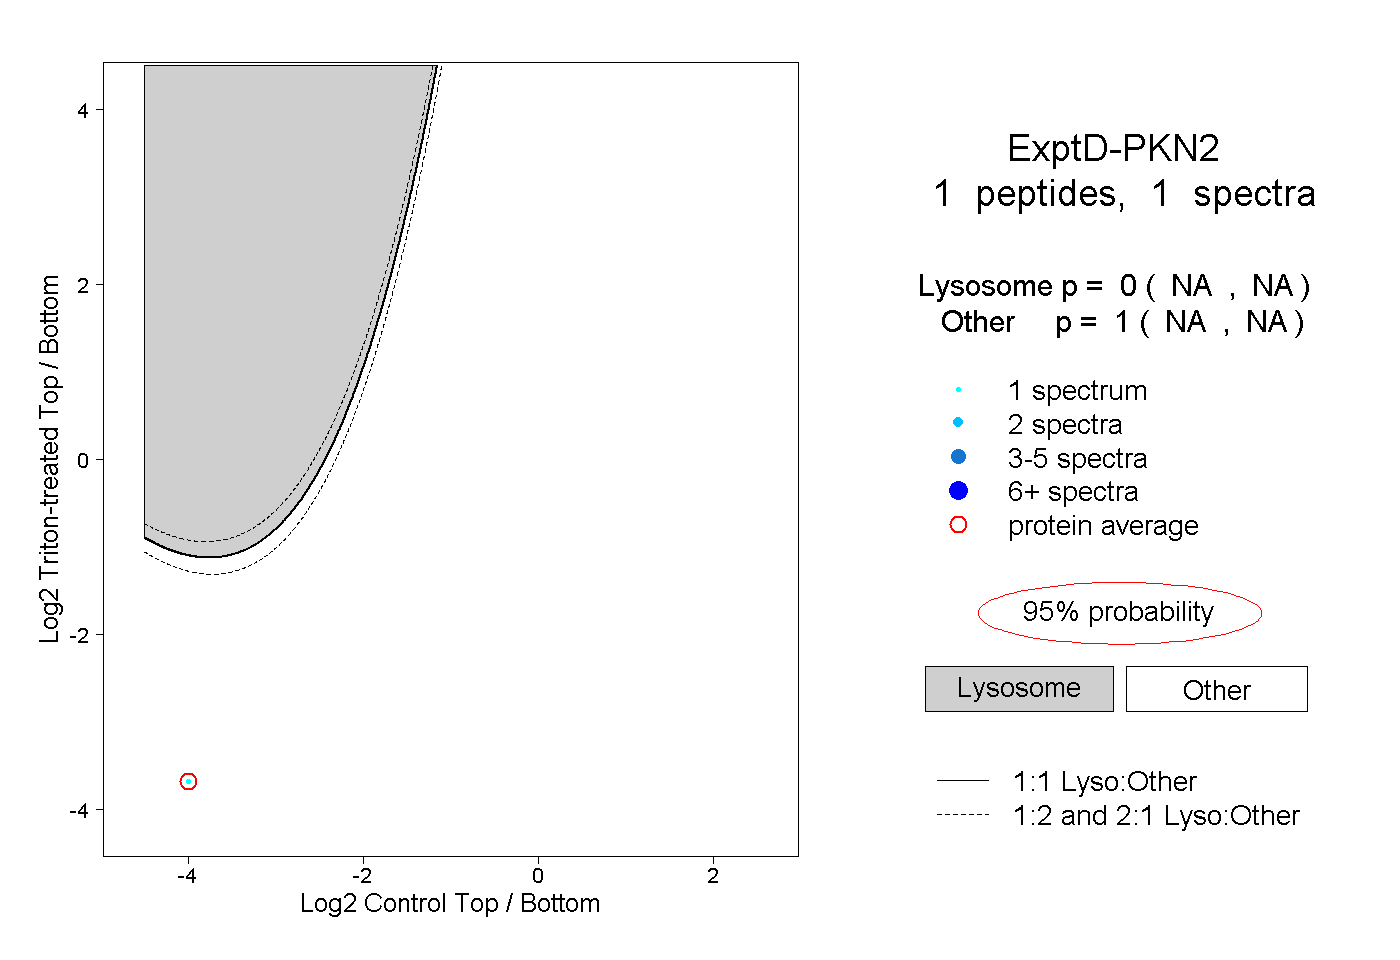
NA | NA
NA | NA