 11
11peptides
spectra
0.000 | 0.000
0.000 | 0.004
0.006 | 0.046
0.000 | 0.019
0.218 | 0.273
0.000 | 0.046
0.687 | 0.711
0.000 | 0.000
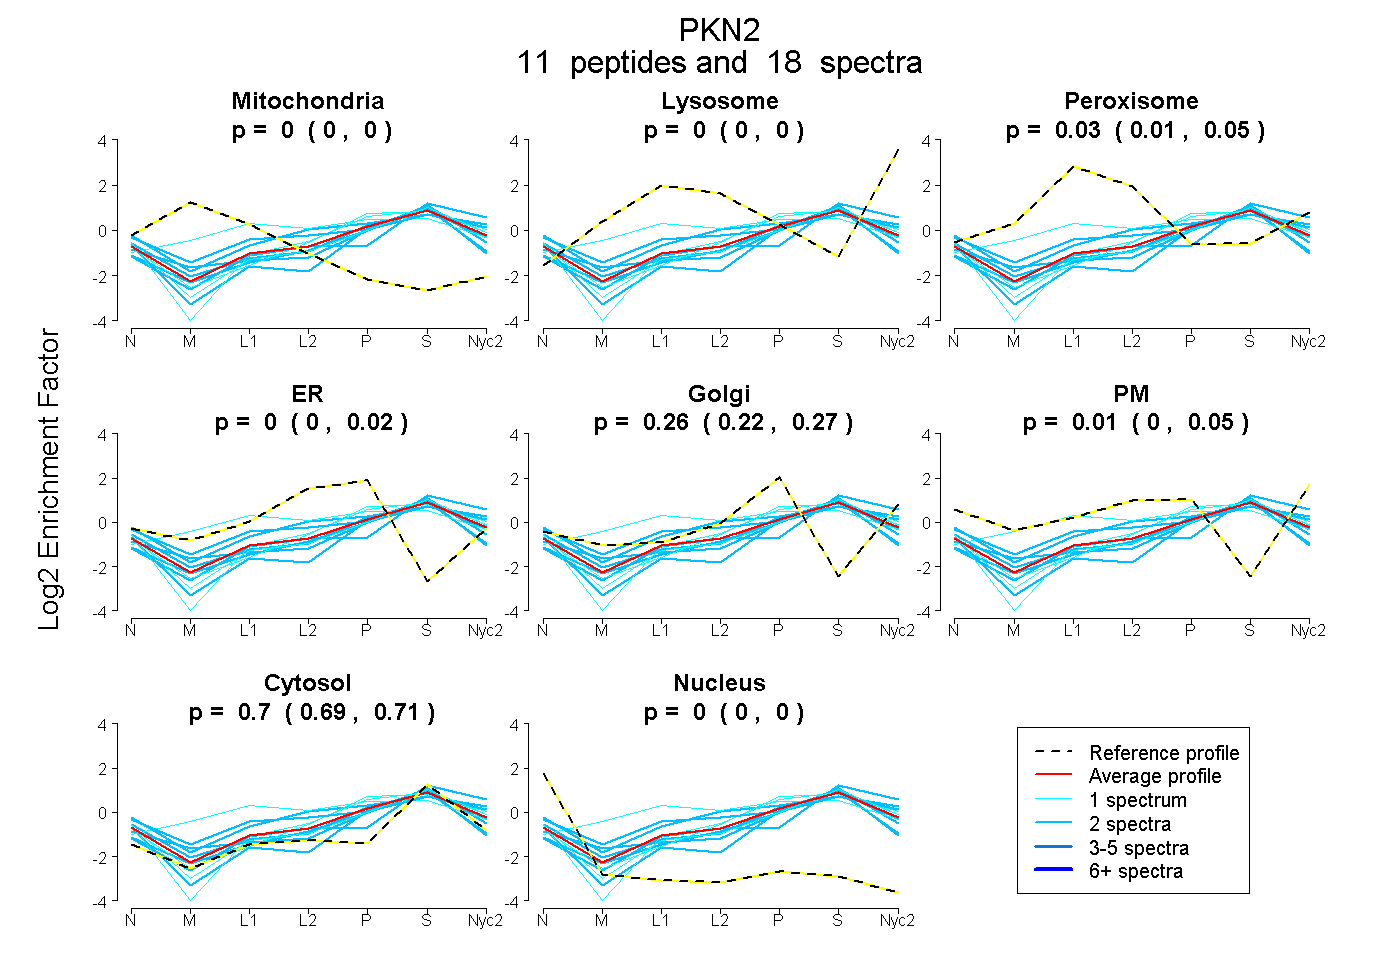
| Plot | Mito | Lyso | Perox | ER | Golgi | PM | Cytosol | Nucleus | |||||
| Expt A |
11 peptides |
18 spectra |
|
0.000 0.000 | 0.000 |
0.000 0.000 | 0.004 |
0.033 0.006 | 0.046 |
0.000 0.000 | 0.019 |
0.261 0.218 | 0.273 |
0.008 0.000 | 0.046 |
0.698 0.687 | 0.711 |
0.000 0.000 | 0.000 |
| 1 spectrum, TPDTPNSDSR | 0.000 | 0.000 | 0.000 | 0.000 | 0.280 | 0.000 | 0.720 | 0.000 | ||
| 2 spectra, ASSLGEIDDSSELR | 0.000 | 0.000 | 0.000 | 0.000 | 0.118 | 0.000 | 0.817 | 0.065 | ||
| 2 spectra, FQFNLQDFR | 0.000 | 0.000 | 0.000 | 0.000 | 0.287 | 0.011 | 0.702 | 0.000 | ||
| 1 spectrum, NLAYVDNILK | 0.000 | 0.000 | 0.364 | 0.061 | 0.168 | 0.000 | 0.407 | 0.000 | ||
| 2 spectra, TPELAPPASDSTVTK | 0.000 | 0.000 | 0.145 | 0.000 | 0.050 | 0.228 | 0.577 | 0.000 | ||
| 2 spectra, DEVDSLMCEK | 0.008 | 0.000 | 0.000 | 0.026 | 0.205 | 0.000 | 0.761 | 0.000 | ||
| 2 spectra, IADFGLCK | 0.000 | 0.000 | 0.048 | 0.036 | 0.000 | 0.331 | 0.585 | 0.000 | ||
| 2 spectra, LEDFLDNER | 0.000 | 0.163 | 0.000 | 0.000 | 0.027 | 0.000 | 0.810 | 0.000 | ||
| 1 spectrum, VKPPFVPTIR | 0.000 | 0.000 | 0.000 | 0.000 | 0.229 | 0.000 | 0.771 | 0.000 | ||
| 2 spectra, ILLEEEQEMFR | 0.000 | 0.000 | 0.000 | 0.000 | 0.213 | 0.000 | 0.787 | 0.000 | ||
| 1 spectrum, LEDFLDNQR | 0.000 | 0.000 | 0.000 | 0.000 | 0.360 | 0.000 | 0.640 | 0.000 |
| Plot | Mito | Lyso or Perox | ER | Golgi | PM | Cytosol | Nucleus | ||||||
| Expt B |
1 peptide |
1 spectrum |
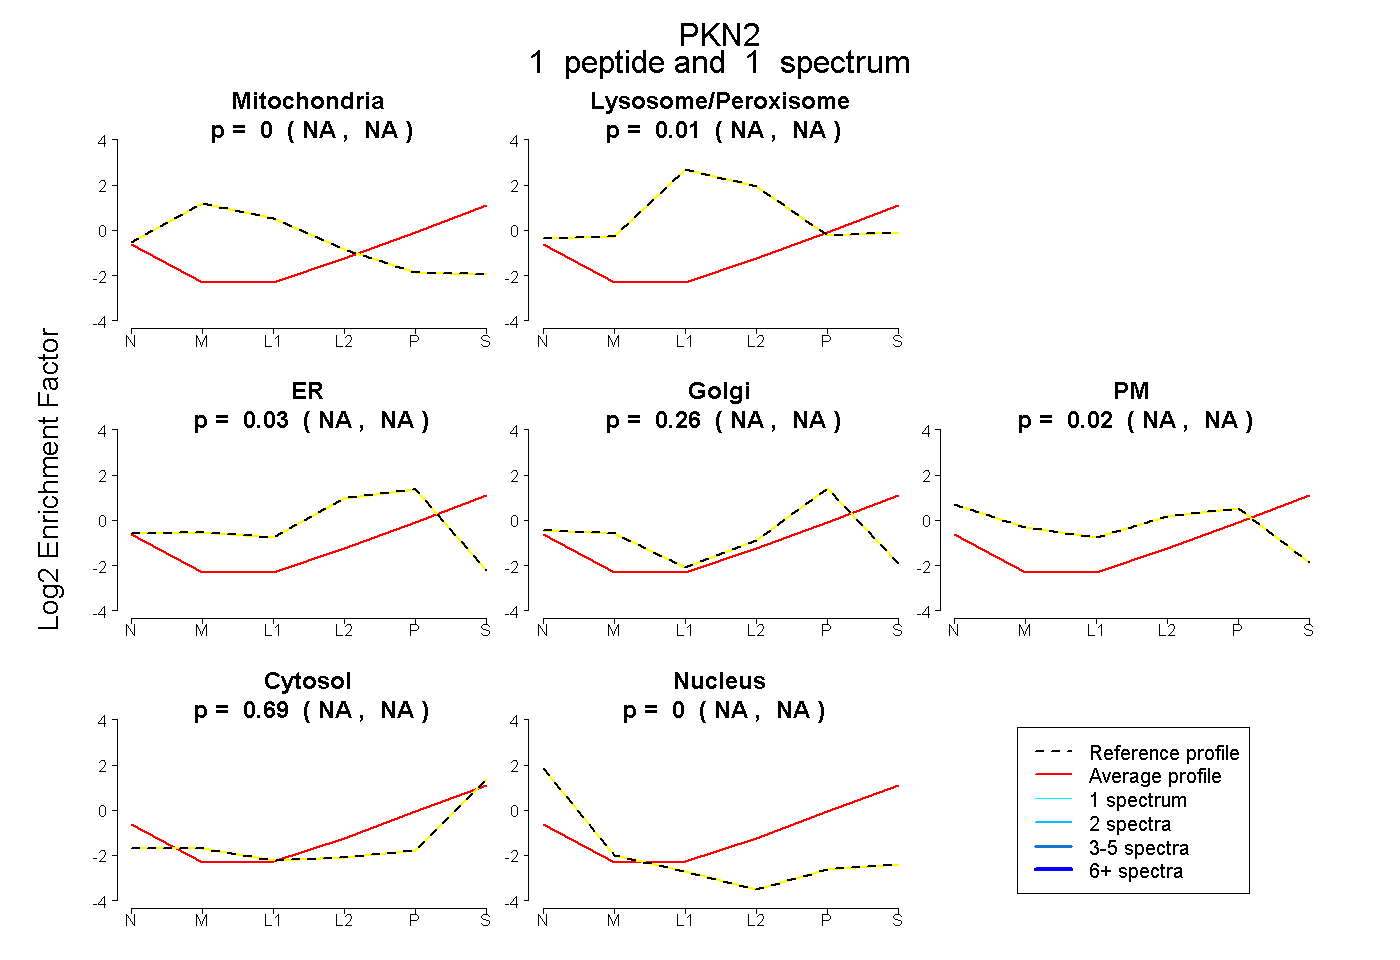 |
0.000 NA | NA |
0.007 NA | NA |
0.028 NA | NA |
0.258 NA | NA |
0.021 NA | NA |
0.686 NA | NA |
0.000 NA | NA |
|||
| Plot | Lyso | Other | |||||||||||
| Expt C |
5 peptides |
10 spectra |
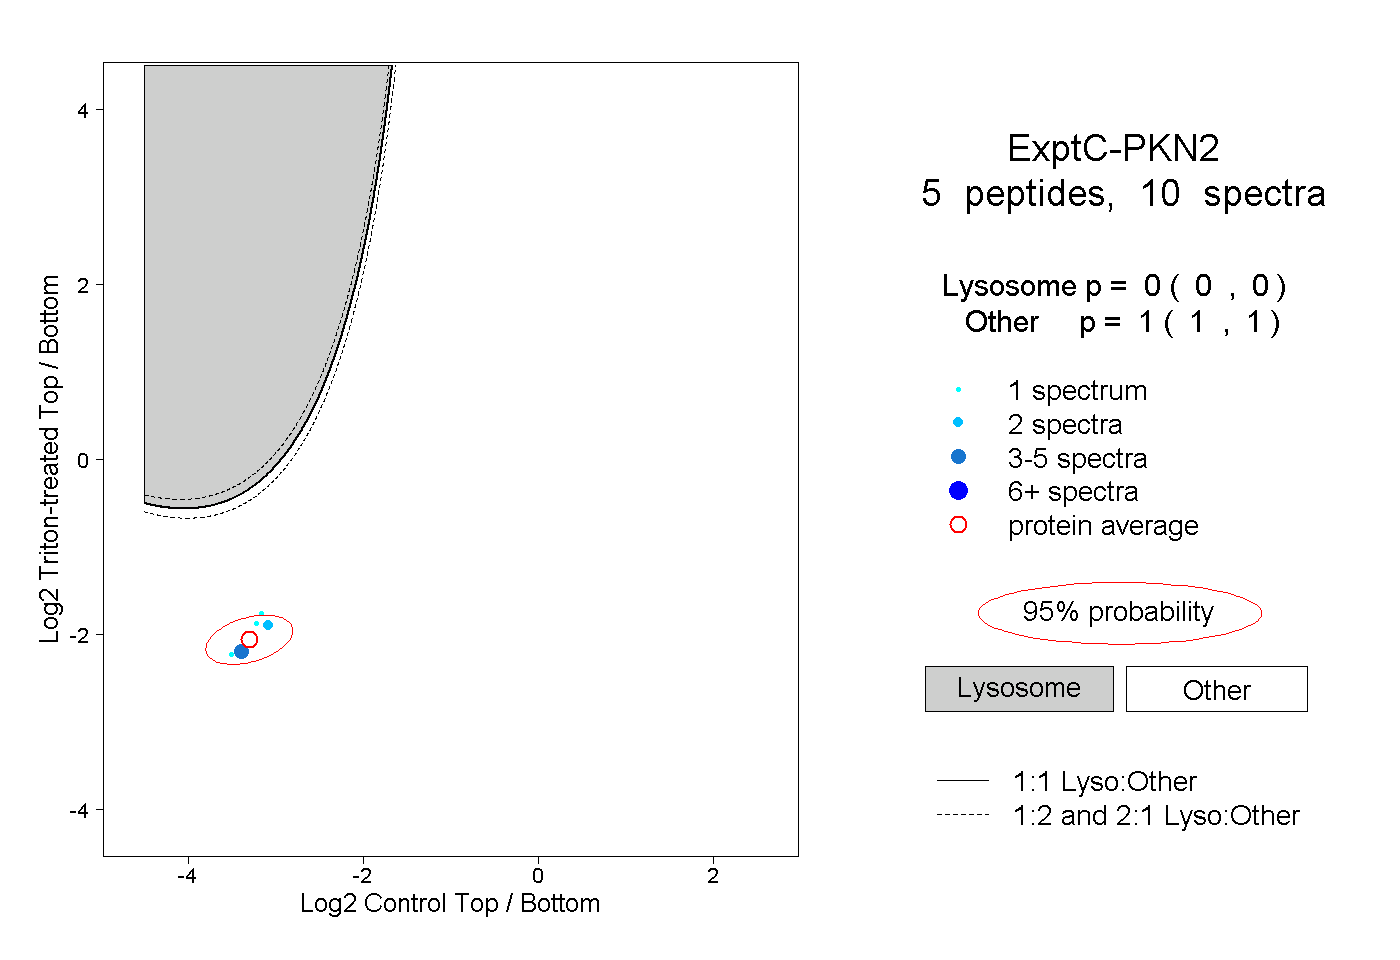 |
0.000 0.000 | 0.000 |
1.000 1.000 | 1.000 |
||||||||
| Plot | Lyso | Other | |||||||||||
| Expt D |
1 peptide |
1 spectrum |
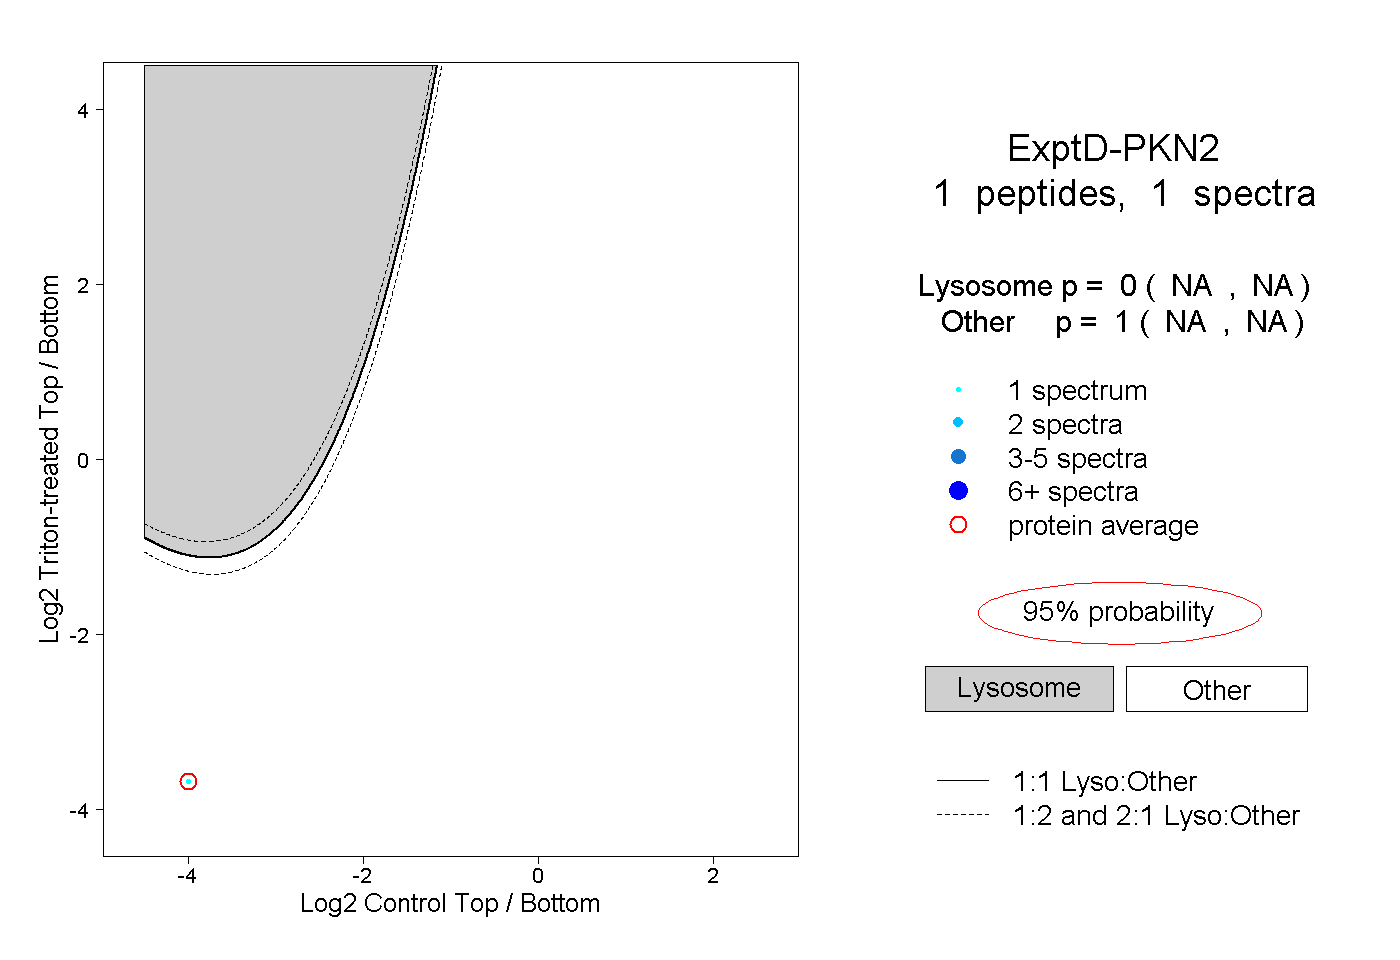 |
0.000 NA | NA |
1.000 NA | NA |