 6
6peptides
spectra
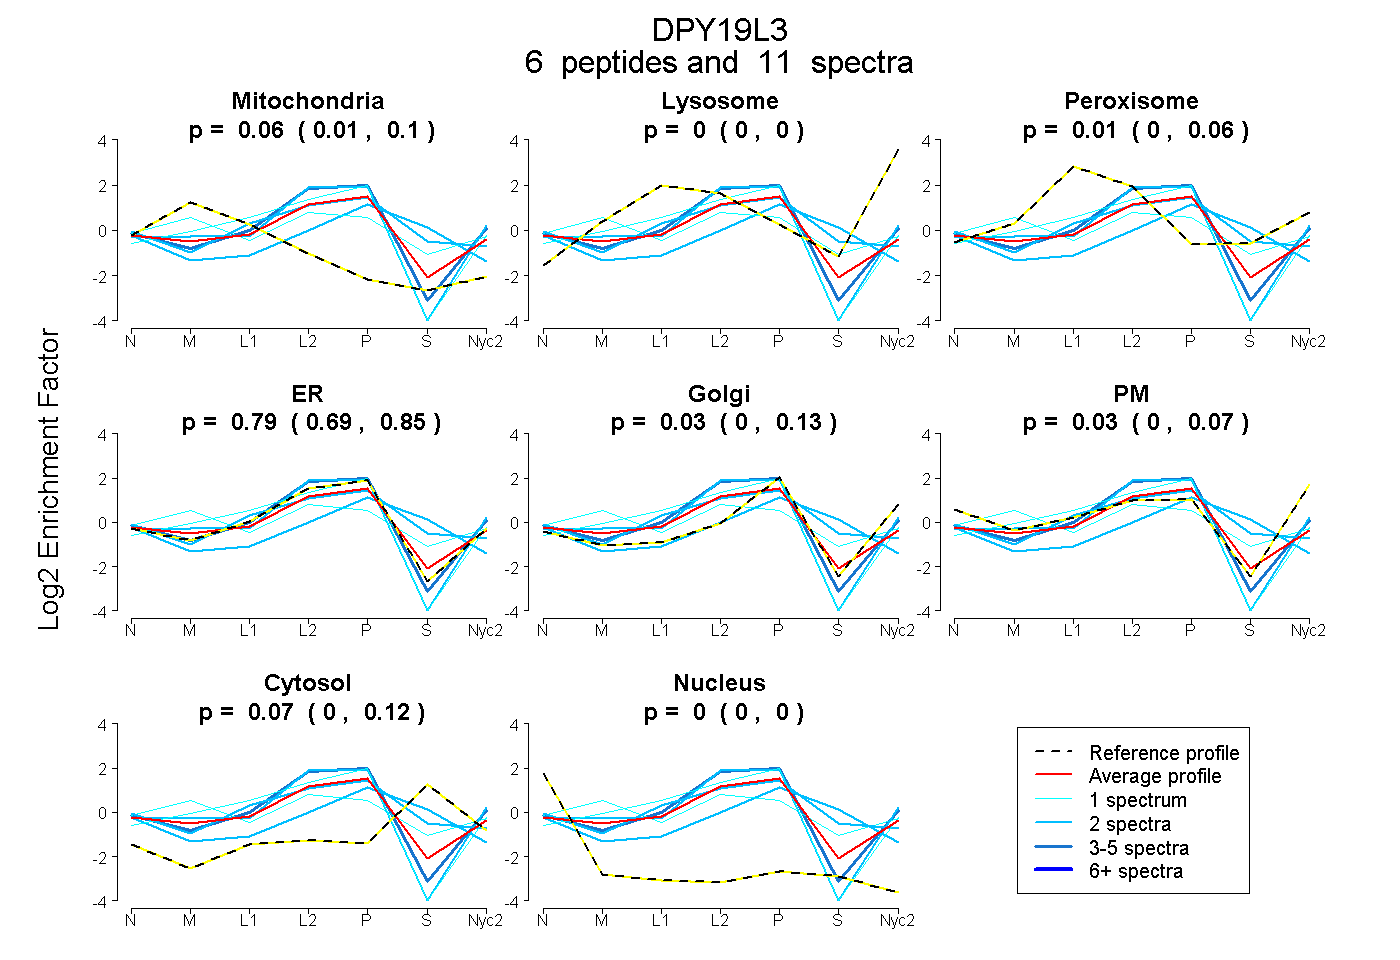
0.006 | 0.103
0.000 | 0.000
0.000 | 0.064
0.690 | 0.845
0.000 | 0.130
0.000 | 0.067
0.000 | 0.119
0.000 | 0.002
2peptides
spectra
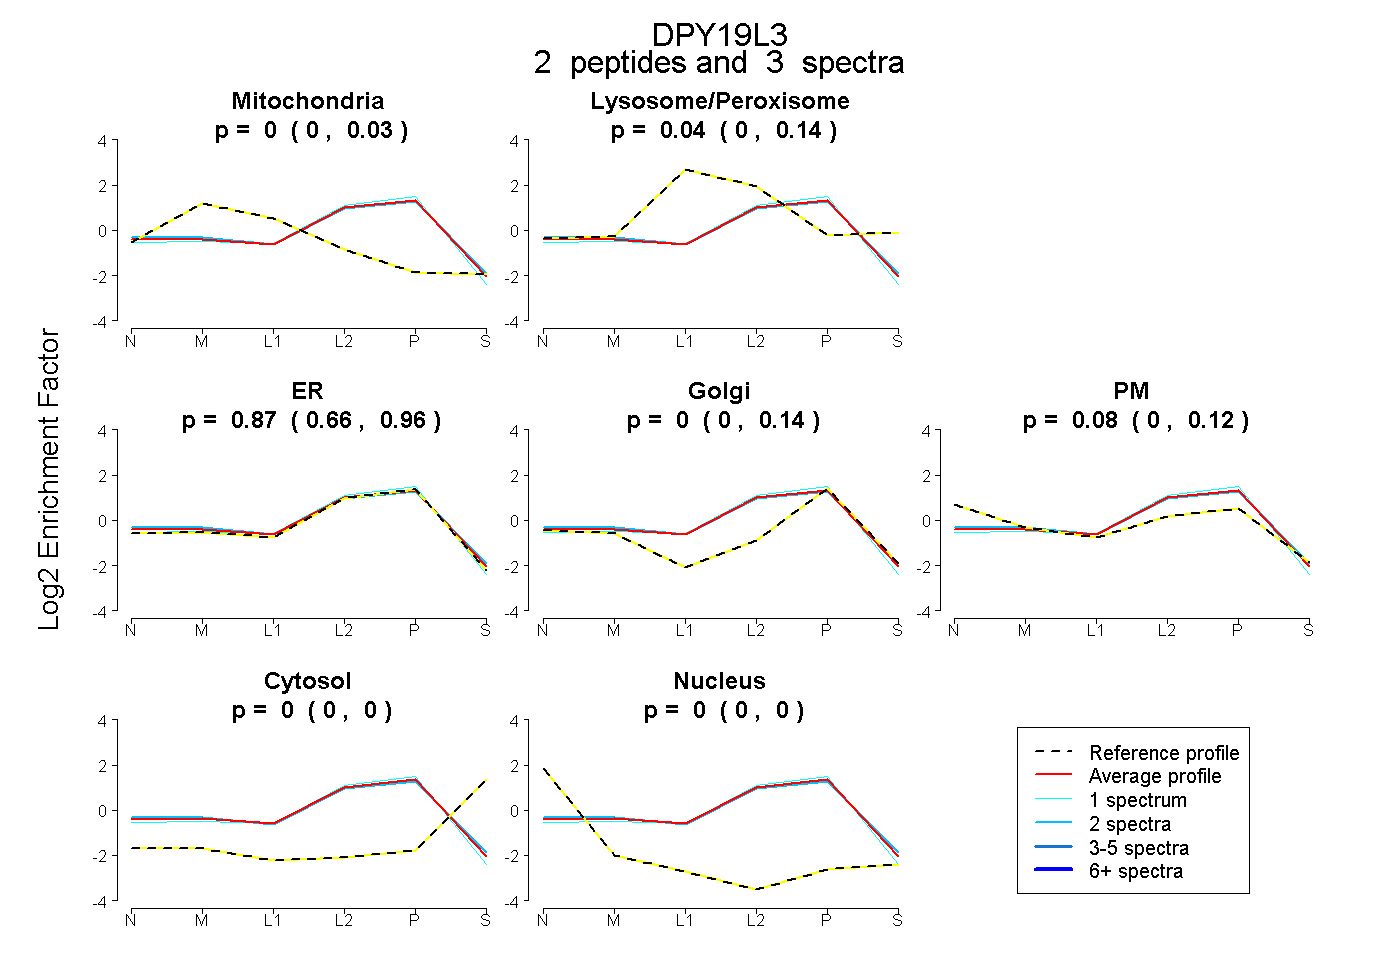
0.000 | 0.026
0.000 | 0.137
0.662 | 0.963
0.000 | 0.140
0.000 | 0.118
0.000 | 0.000
0.000 | 0.000
6peptides
spectra
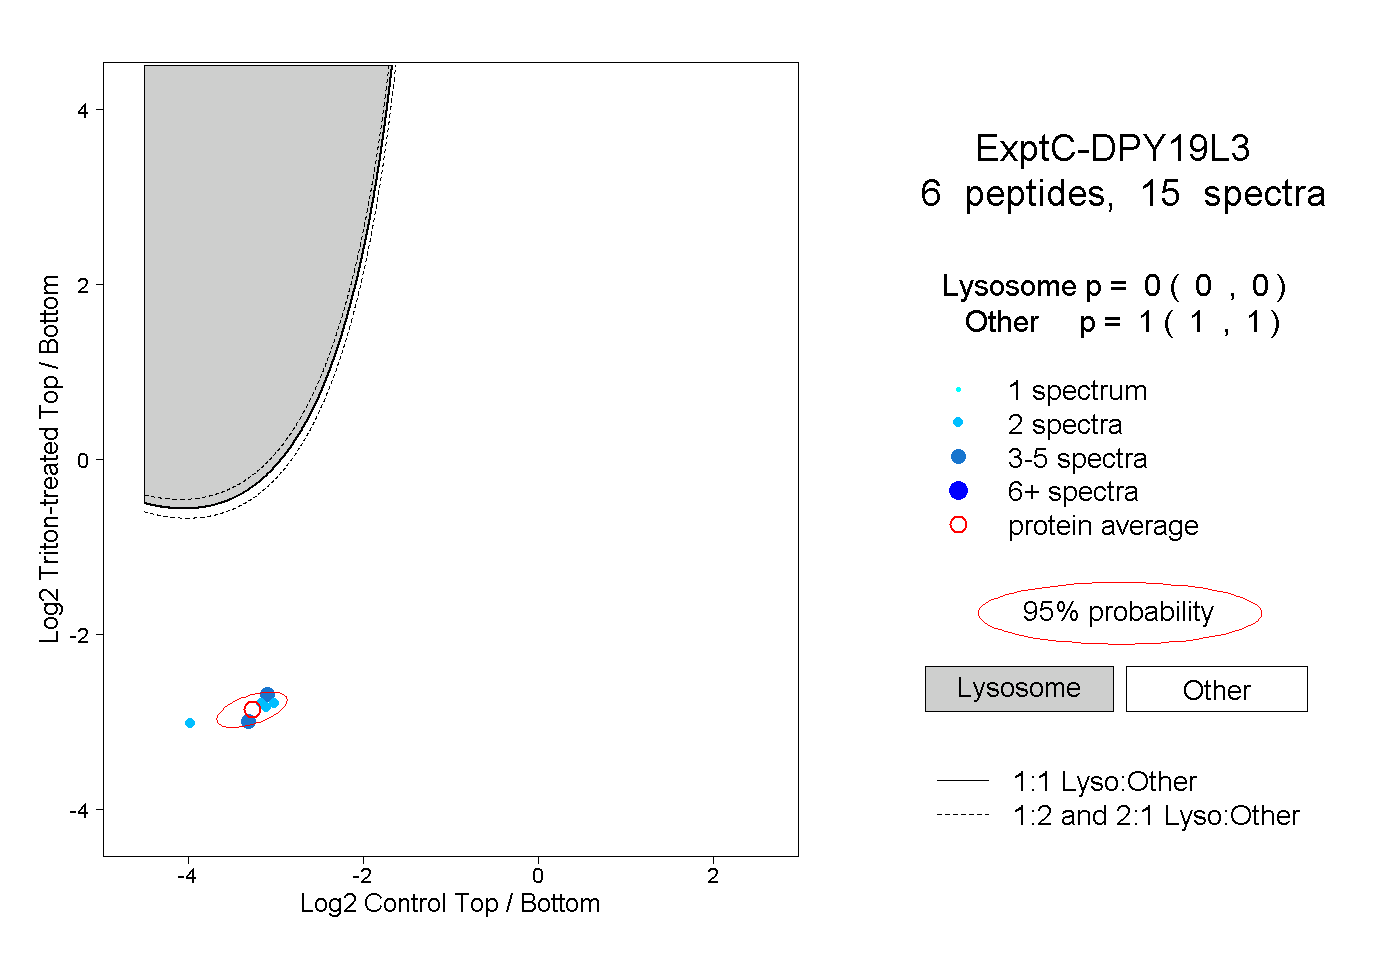
0.000 | 0.000
1.000 | 1.000