 6
6peptides
spectra
0.006 | 0.103
0.000 | 0.000
0.000 | 0.064
0.690 | 0.845
0.000 | 0.130
0.000 | 0.067
0.000 | 0.119
0.000 | 0.002
| Plot | Mito | Lyso | Perox | ER | Golgi | PM | Cytosol | Nucleus | |||||
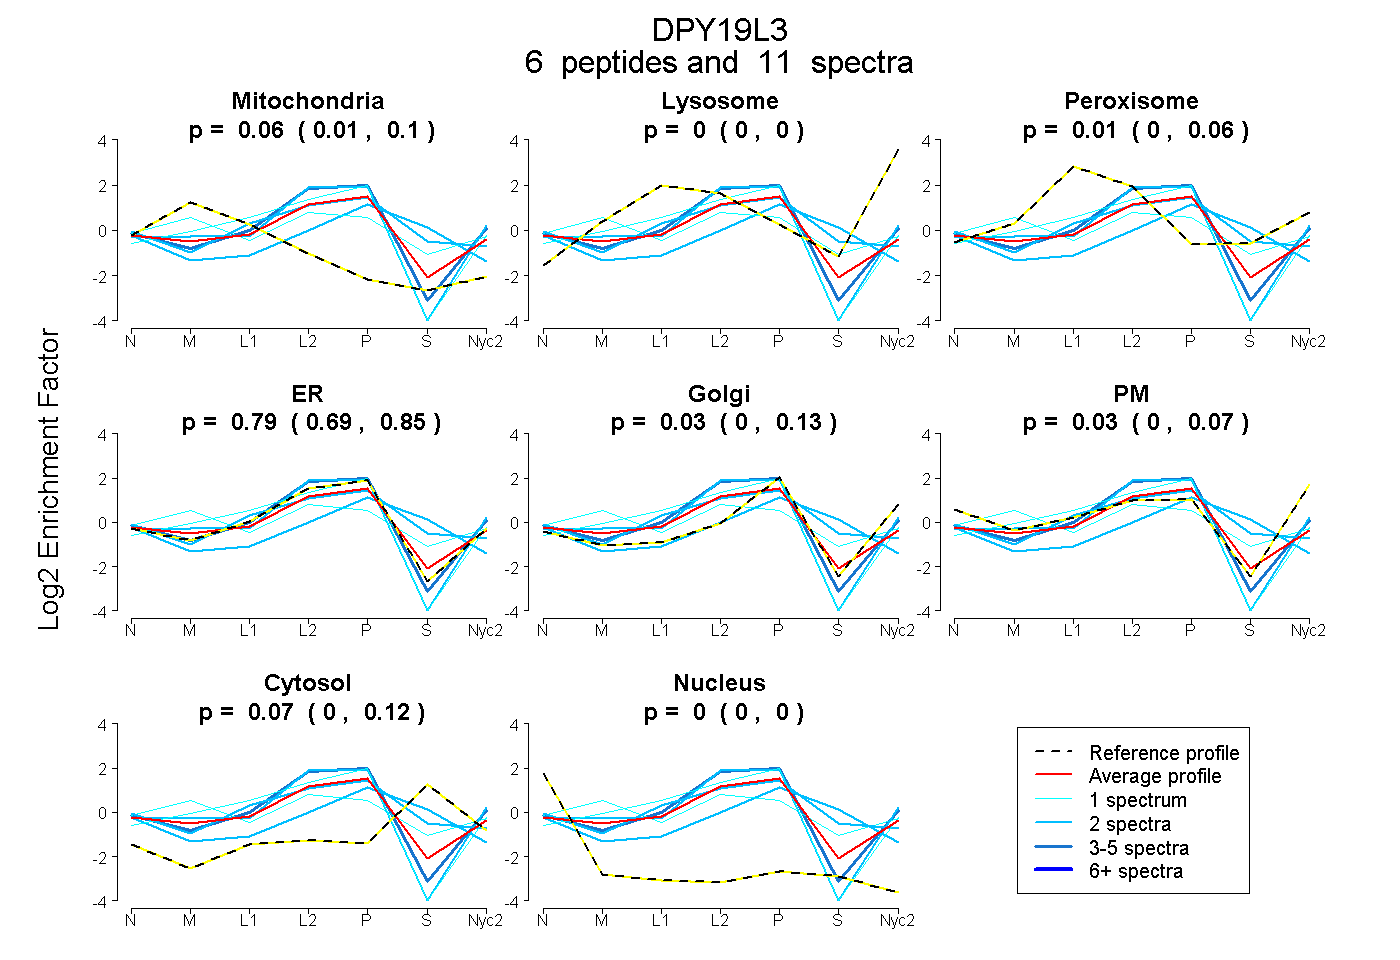
| Expt A |
6 peptides |
11 spectra |
|
0.063 0.006 | 0.103 |
0.000 0.000 | 0.000 |
0.014 0.000 | 0.064 |
0.791 0.690 | 0.845 |
0.034 0.000 | 0.130 |
0.027 0.000 | 0.067 |
0.070 0.000 | 0.119 |
0.000 0.000 | 0.002 |
| 1 spectrum, VLPIQK | 0.056 | 0.002 | 0.000 | 0.942 | 0.000 | 0.000 | 0.000 | 0.000 | ||
| 2 spectra, TLTNHPHYEDK | 0.000 | 0.000 | 0.158 | 0.604 | 0.000 | 0.000 | 0.238 | 0.000 | ||
| 1 spectrum, NLPSYAAHFTR | 0.195 | 0.008 | 0.099 | 0.333 | 0.030 | 0.187 | 0.148 | 0.000 | ||
| 2 spectra, LPSGCASGR | 0.000 | 0.000 | 0.000 | 0.484 | 0.000 | 0.000 | 0.497 | 0.019 | ||
| 3 spectra, FGFGATR | 0.000 | 0.000 | 0.000 | 0.911 | 0.000 | 0.089 | 0.000 | 0.000 | ||
| 2 spectra, TINLLQR | 0.000 | 0.000 | 0.000 | 0.892 | 0.000 | 0.108 | 0.000 | 0.000 |
| Plot | Mito | Lyso or Perox | ER | Golgi | PM | Cytosol | Nucleus | ||||||
| Expt B |
2 peptides |
3 spectra |
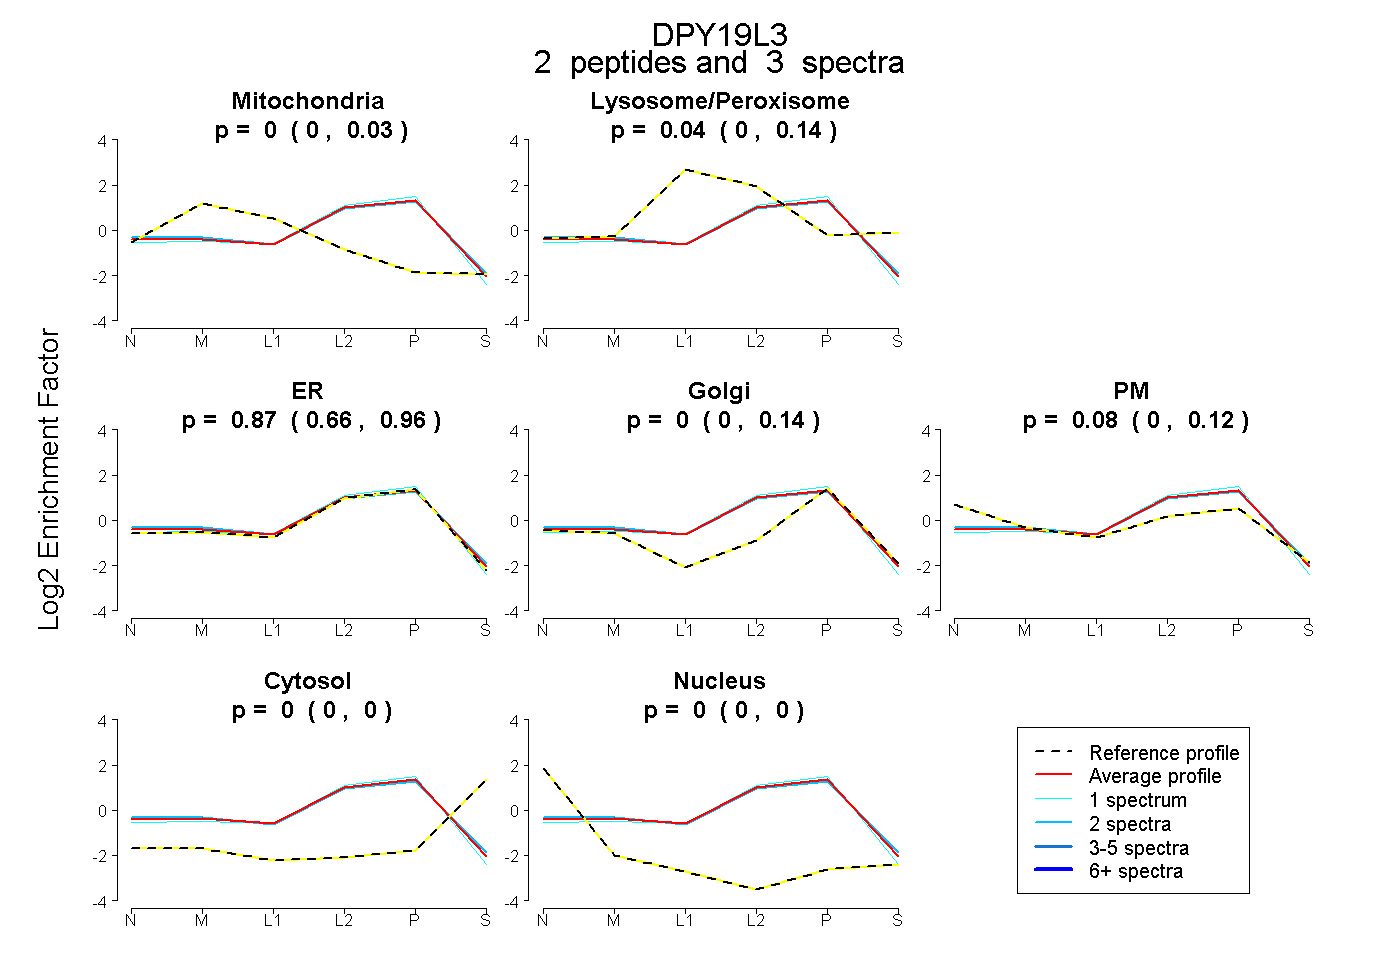 |
0.000 0.000 | 0.026 |
0.044 0.000 | 0.137 |
0.873 0.662 | 0.963 |
0.000 0.000 | 0.140 |
0.083 0.000 | 0.118 |
0.000 0.000 | 0.000 |
0.000 0.000 | 0.000 |
|||
| Plot | Lyso | Other | |||||||||||
| Expt C |
6 peptides |
15 spectra |
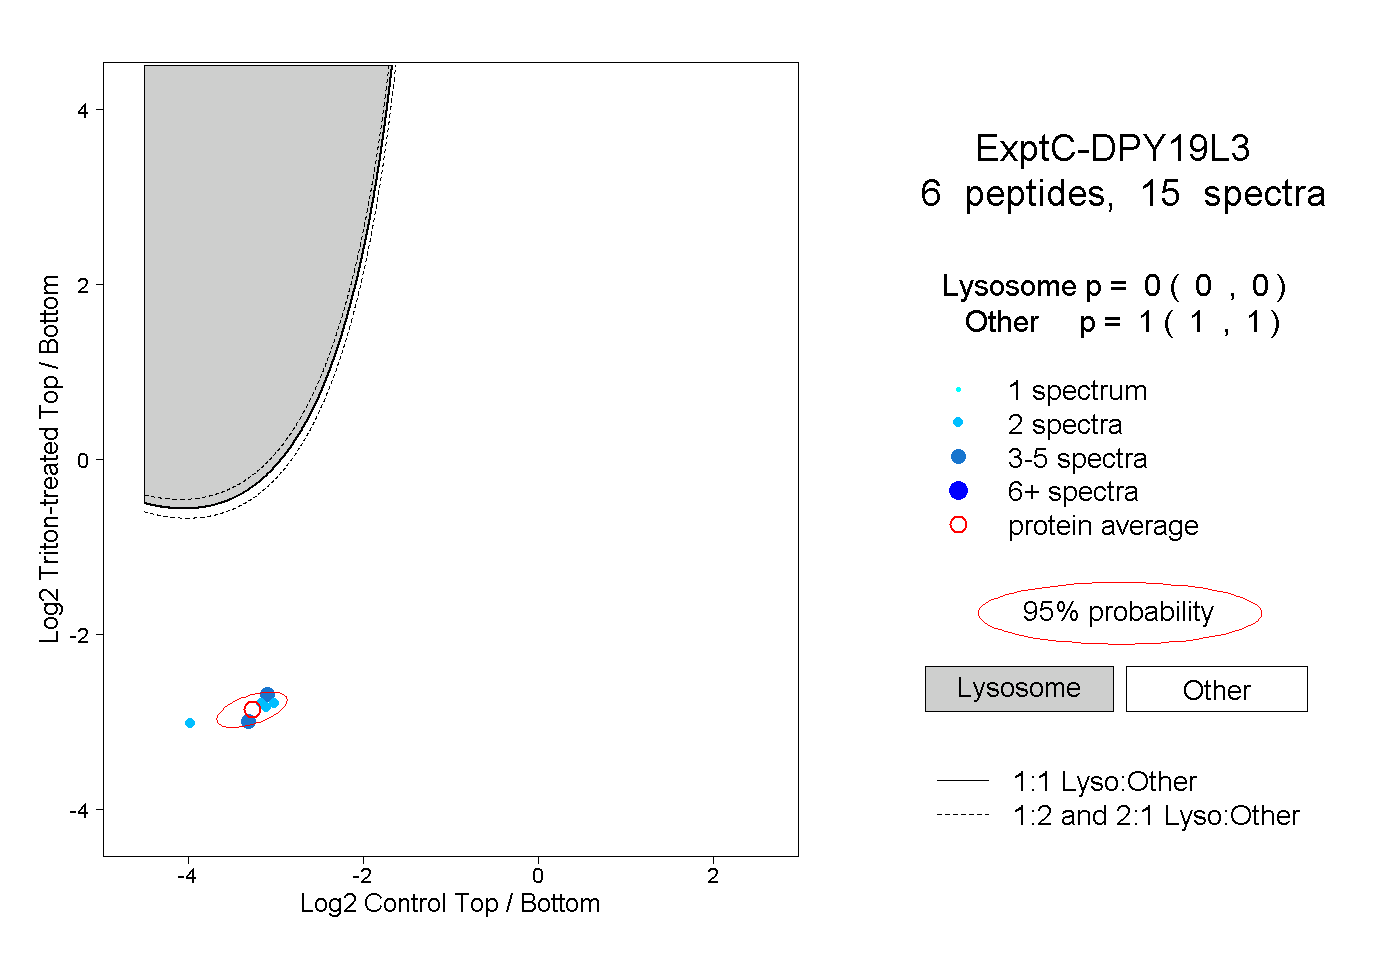 |
0.000 0.000 | 0.000 |
1.000 1.000 | 1.000 |