 11
11peptides
spectra
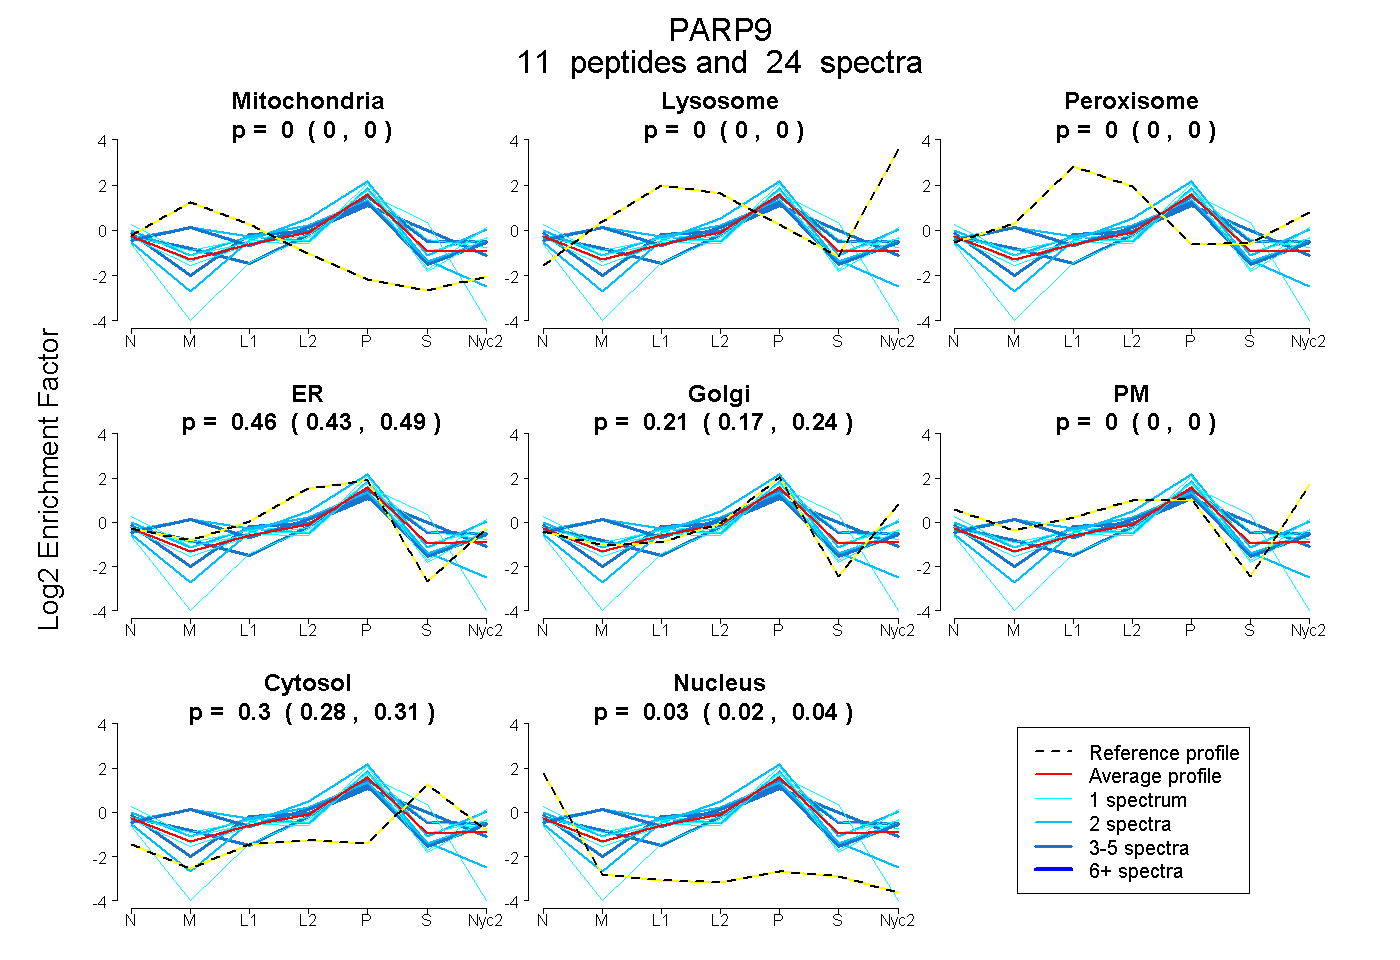
0.000 | 0.000
0.000 | 0.000
0.000 | 0.000
0.427 | 0.490
0.167 | 0.243
0.000 | 0.000
0.284 | 0.315
0.018 | 0.040
11peptides
spectra
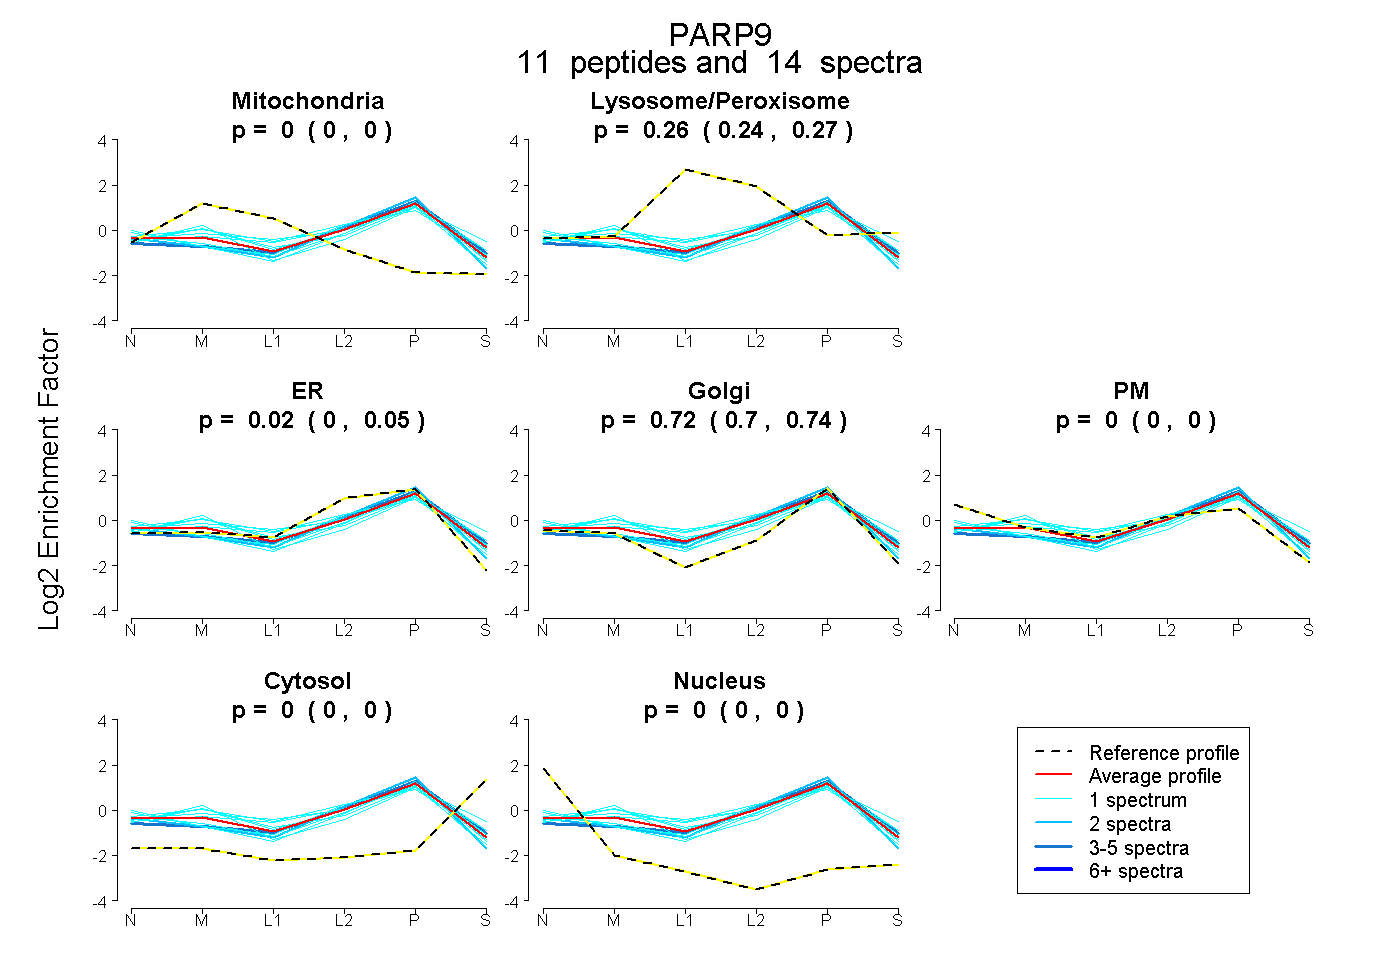
0.000 | 0.000
0.241 | 0.268
0.000 | 0.051
0.699 | 0.735
0.000 | 0.000
0.000 | 0.000
0.000 | 0.000
12peptides
spectra
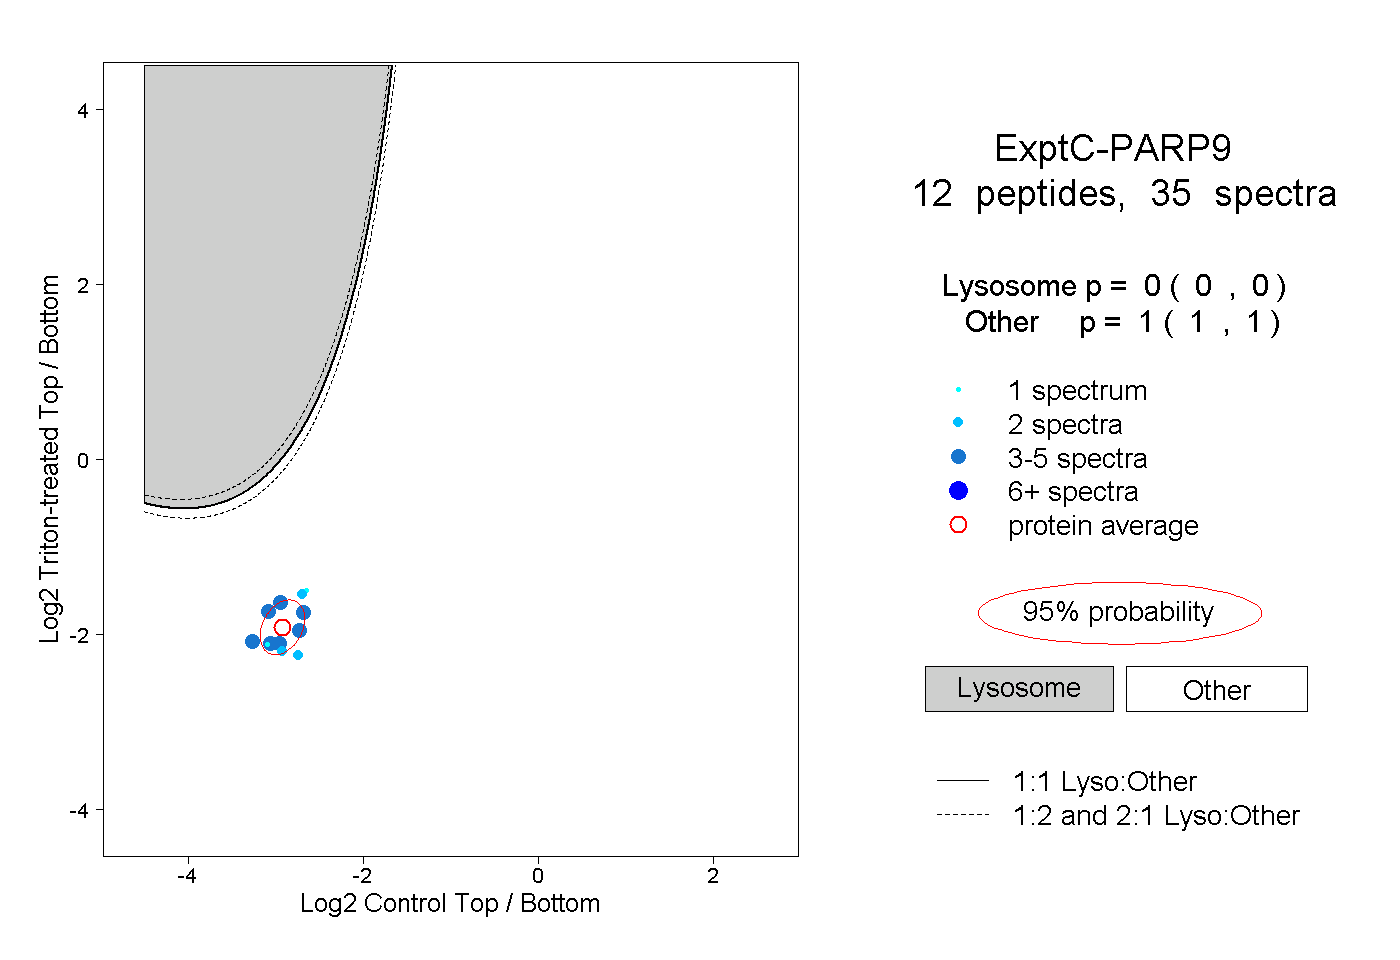
0.000 | 0.000
1.000 | 1.000
2peptides
spectra
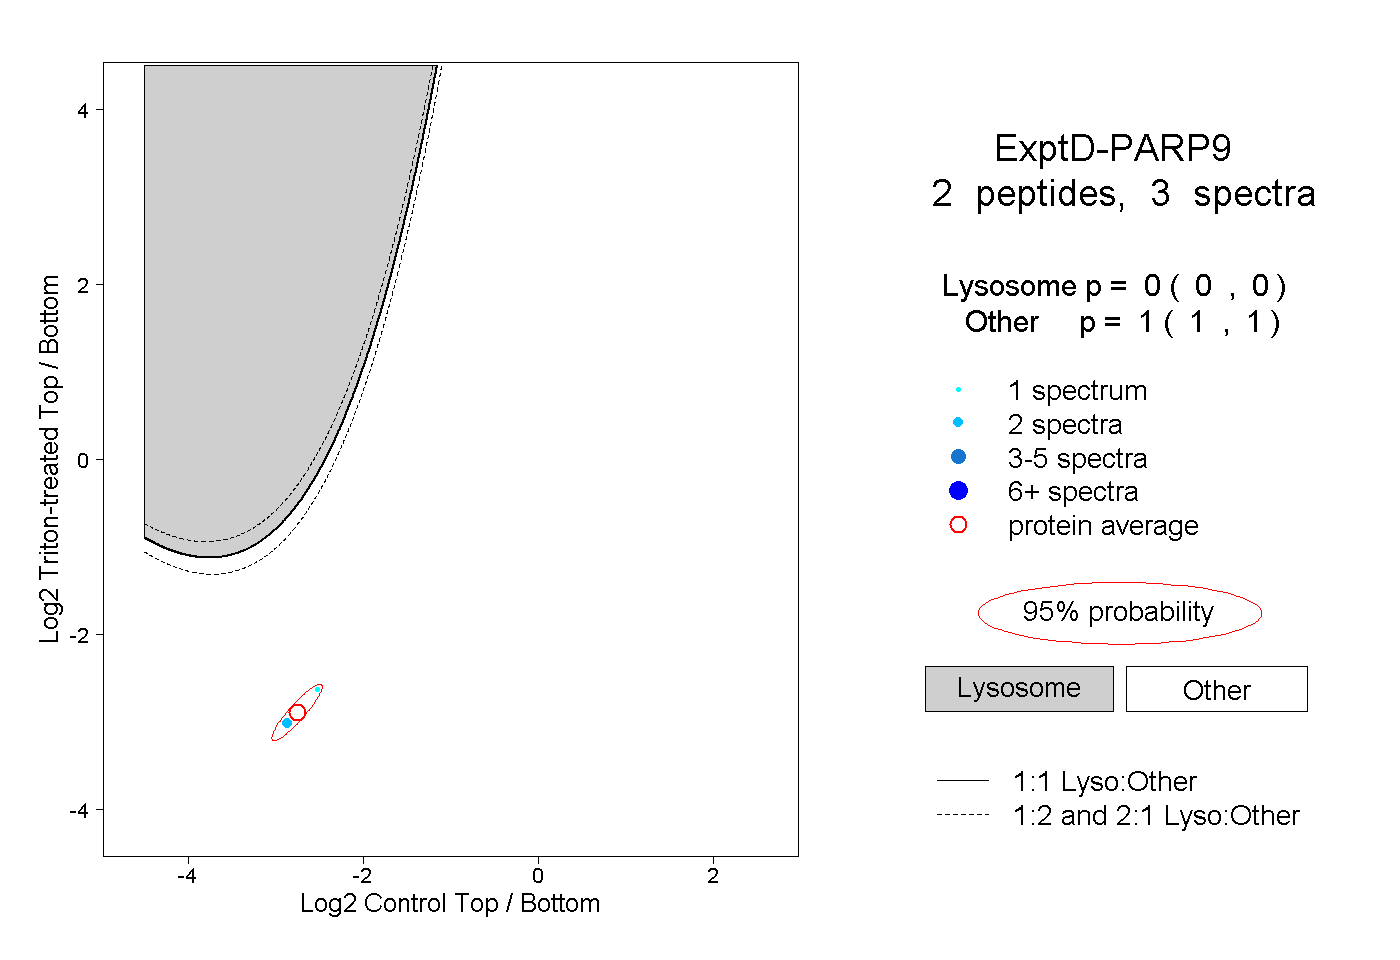
0.000 | 0.000
1.000 | 1.000