 11
11peptides
spectra
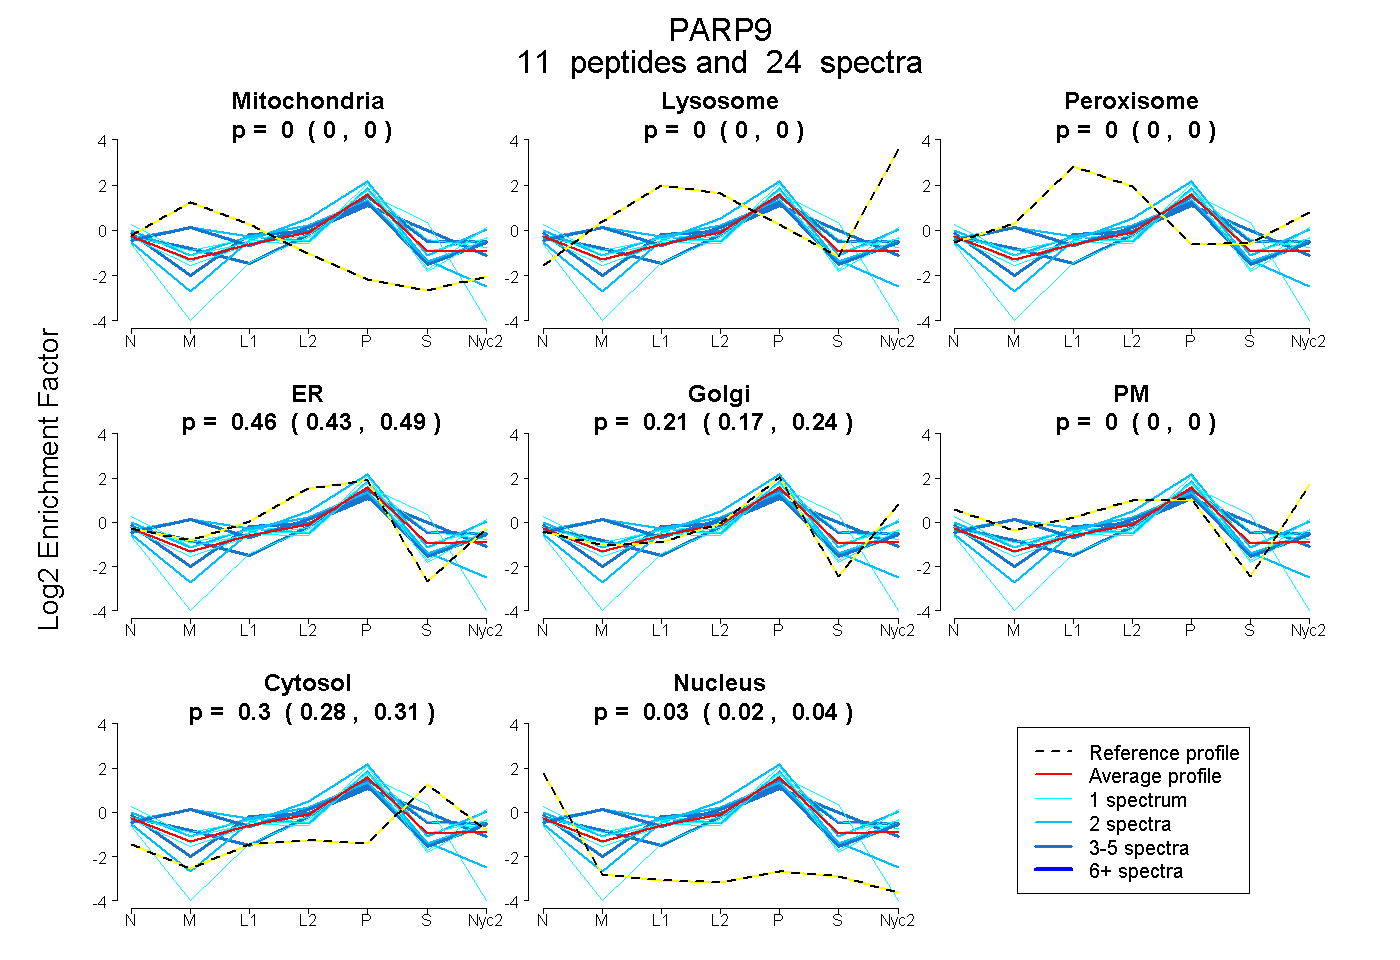
0.000 | 0.000
0.000 | 0.000
0.000 | 0.000
0.427 | 0.490
0.167 | 0.243
0.000 | 0.000
0.284 | 0.315
0.018 | 0.040
| Plot | Mito | Lyso | Perox | ER | Golgi | PM | Cytosol | Nucleus | |||||
| Expt A |
11 peptides |
24 spectra |
|
0.000 0.000 | 0.000 |
0.000 0.000 | 0.000 |
0.000 0.000 | 0.000 |
0.462 0.427 | 0.490 |
0.208 0.167 | 0.243 |
0.000 0.000 | 0.000 |
0.301 0.284 | 0.315 |
0.030 0.018 | 0.040 |
| 1 spectrum, SNESQLYEVLQK | 0.000 | 0.000 | 0.023 | 0.333 | 0.401 | 0.000 | 0.243 | 0.000 | ||
| 3 spectra, FGCICTLR | 0.000 | 0.000 | 0.000 | 0.183 | 0.468 | 0.000 | 0.347 | 0.001 | ||
| 5 spectra, WIATHGK | 0.209 | 0.000 | 0.000 | 0.323 | 0.361 | 0.000 | 0.107 | 0.000 | ||
| 2 spectra, IVIFPVDVETYK | 0.000 | 0.000 | 0.021 | 0.280 | 0.486 | 0.000 | 0.158 | 0.055 | ||
| 2 spectra, LFQQVPHQFCNAVCR | 0.280 | 0.000 | 0.000 | 0.571 | 0.000 | 0.000 | 0.128 | 0.020 | ||
| 1 spectrum, IPVGGFAVTR | 0.000 | 0.000 | 0.000 | 0.289 | 0.000 | 0.000 | 0.520 | 0.191 | ||
| 2 spectra, HNIFEILK | 0.000 | 0.000 | 0.000 | 0.383 | 0.375 | 0.000 | 0.242 | 0.000 | ||
| 1 spectrum, IIVETICLYFQDK | 0.000 | 0.000 | 0.000 | 0.357 | 0.273 | 0.000 | 0.370 | 0.000 | ||
| 1 spectrum, SGQVAQSILK | 0.000 | 0.000 | 0.000 | 0.102 | 0.767 | 0.000 | 0.123 | 0.008 | ||
| 5 spectra, GSQADLIEAVMK | 0.000 | 0.000 | 0.000 | 0.506 | 0.000 | 0.000 | 0.494 | 0.000 | ||
| 1 spectrum, YPTPAGSSSPAQK | 0.000 | 0.000 | 0.033 | 0.147 | 0.655 | 0.000 | 0.049 | 0.117 |
| Plot | Mito | Lyso or Perox | ER | Golgi | PM | Cytosol | Nucleus | ||||||
| Expt B |
11 peptides |
14 spectra |
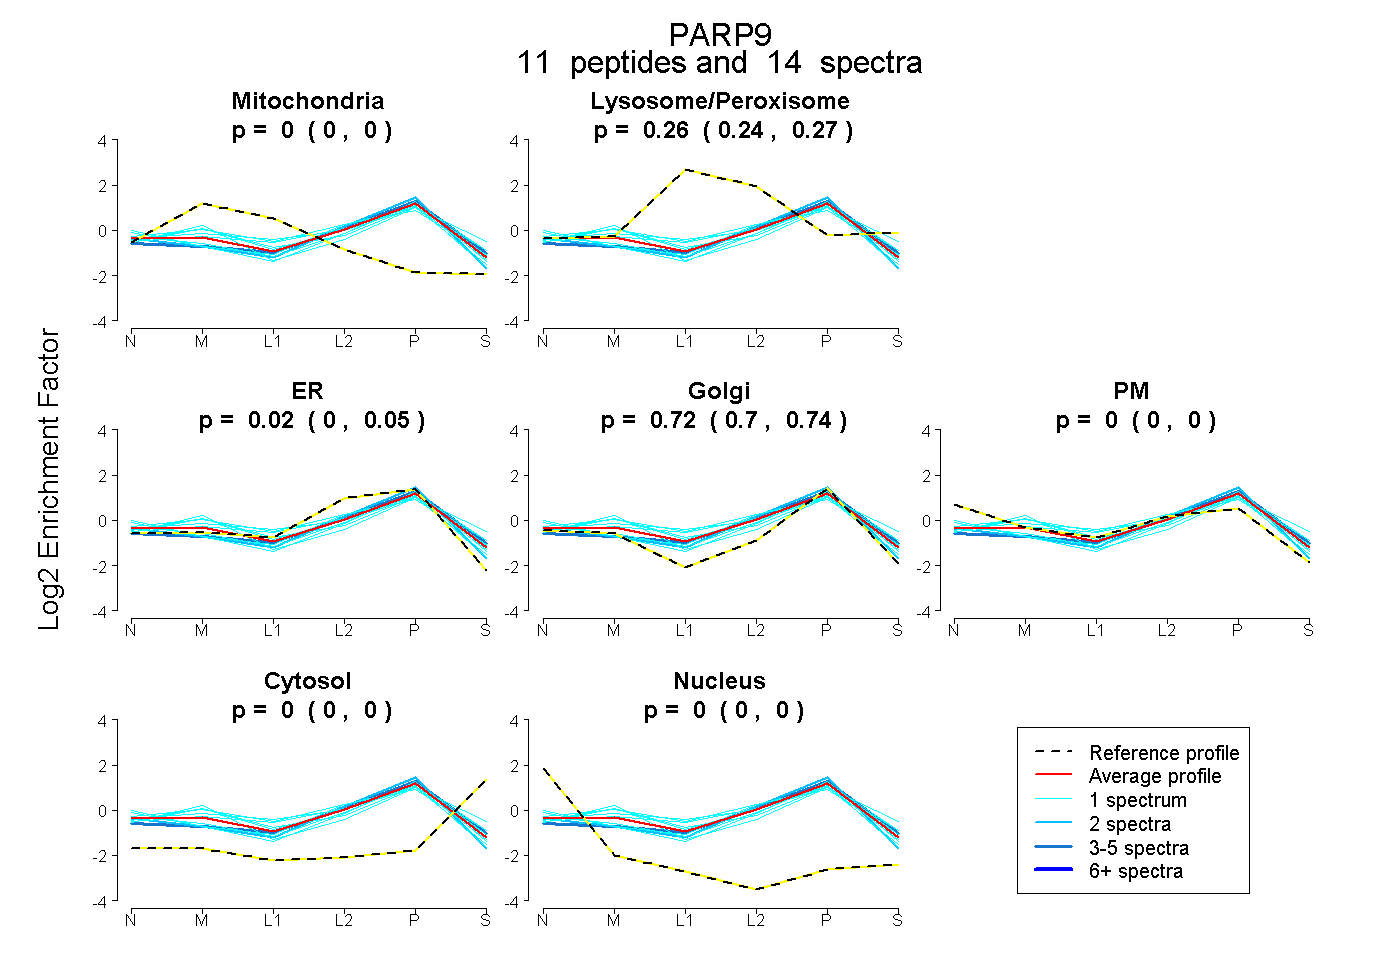 |
0.000 0.000 | 0.000 |
0.257 0.241 | 0.268 |
0.022 0.000 | 0.051 |
0.721 0.699 | 0.735 |
0.000 0.000 | 0.000 |
0.000 0.000 | 0.000 |
0.000 0.000 | 0.000 |
|||
| Plot | Lyso | Other | |||||||||||
| Expt C |
12 peptides |
35 spectra |
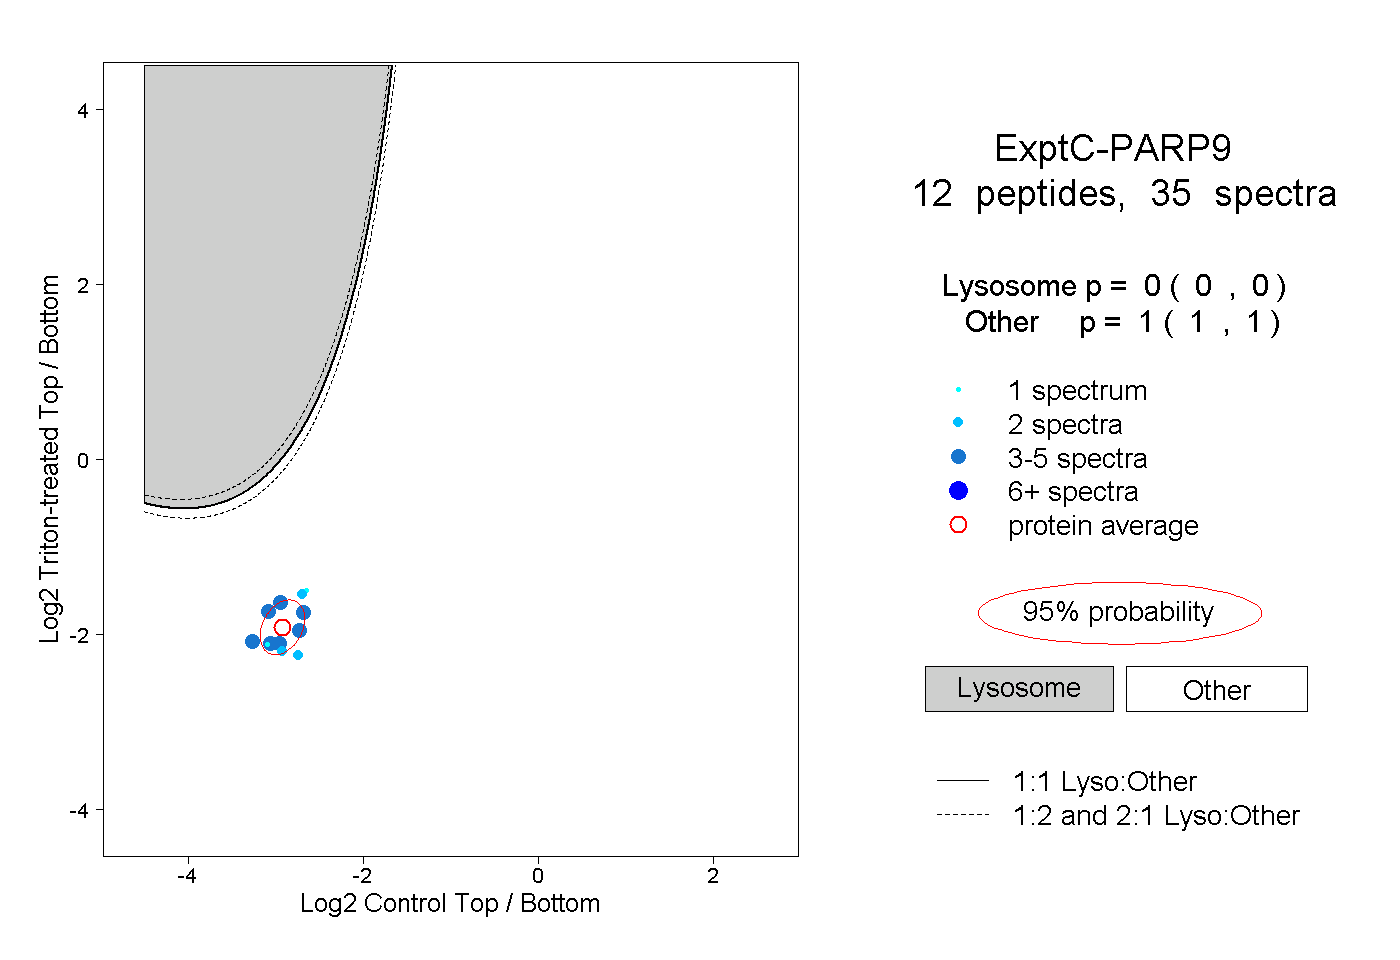 |
0.000 0.000 | 0.000 |
1.000 1.000 | 1.000 |
||||||||
| Plot | Lyso | Other | |||||||||||
| Expt D |
2 peptides |
3 spectra |
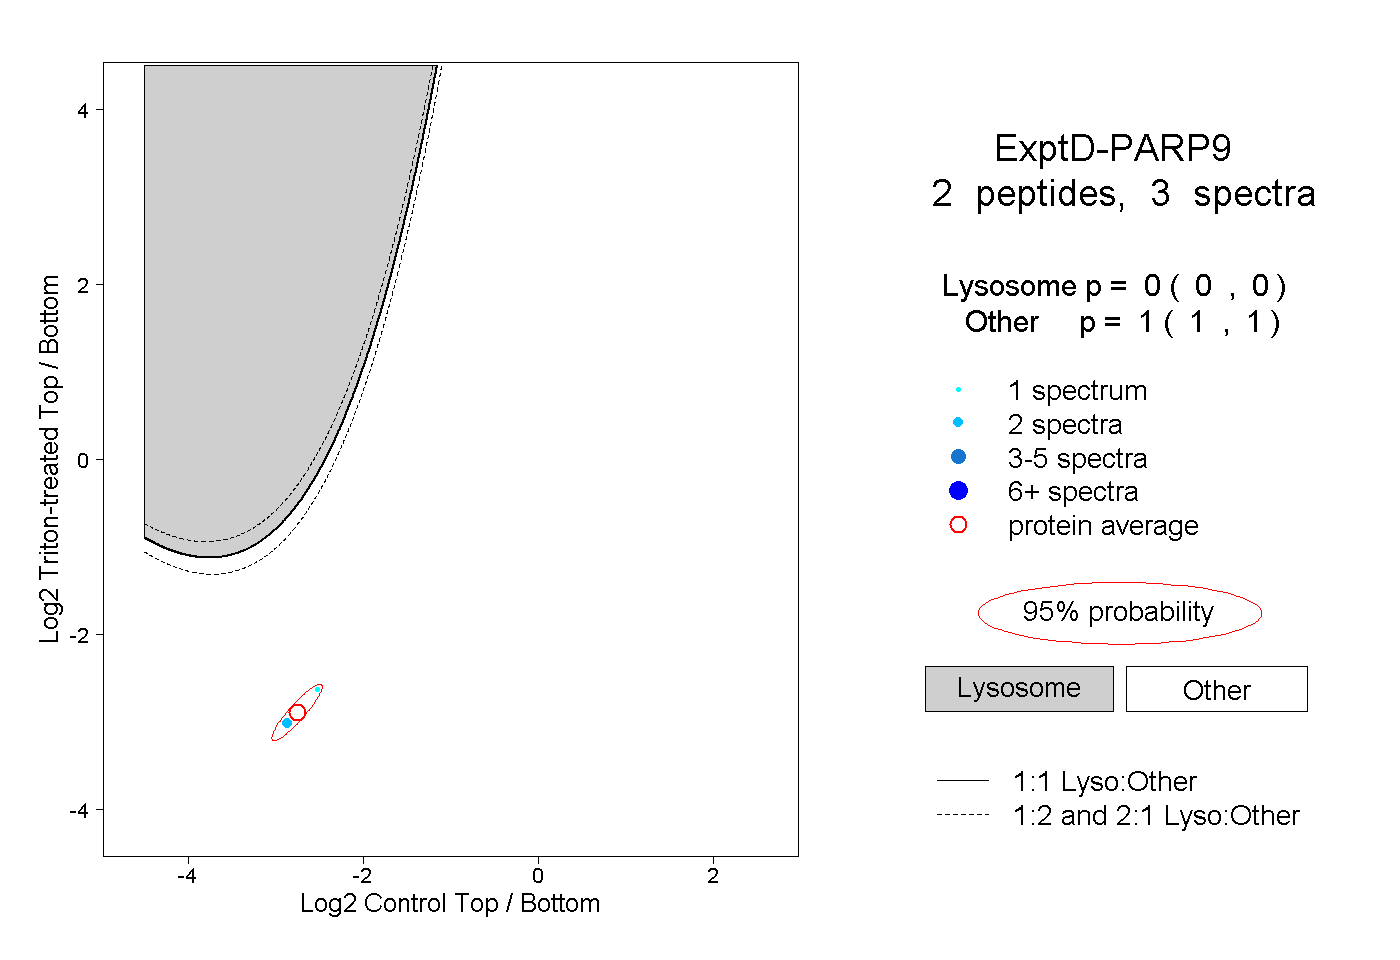 |
0.000 0.000 | 0.000 |
1.000 1.000 | 1.000 |