 5
5peptides
spectra
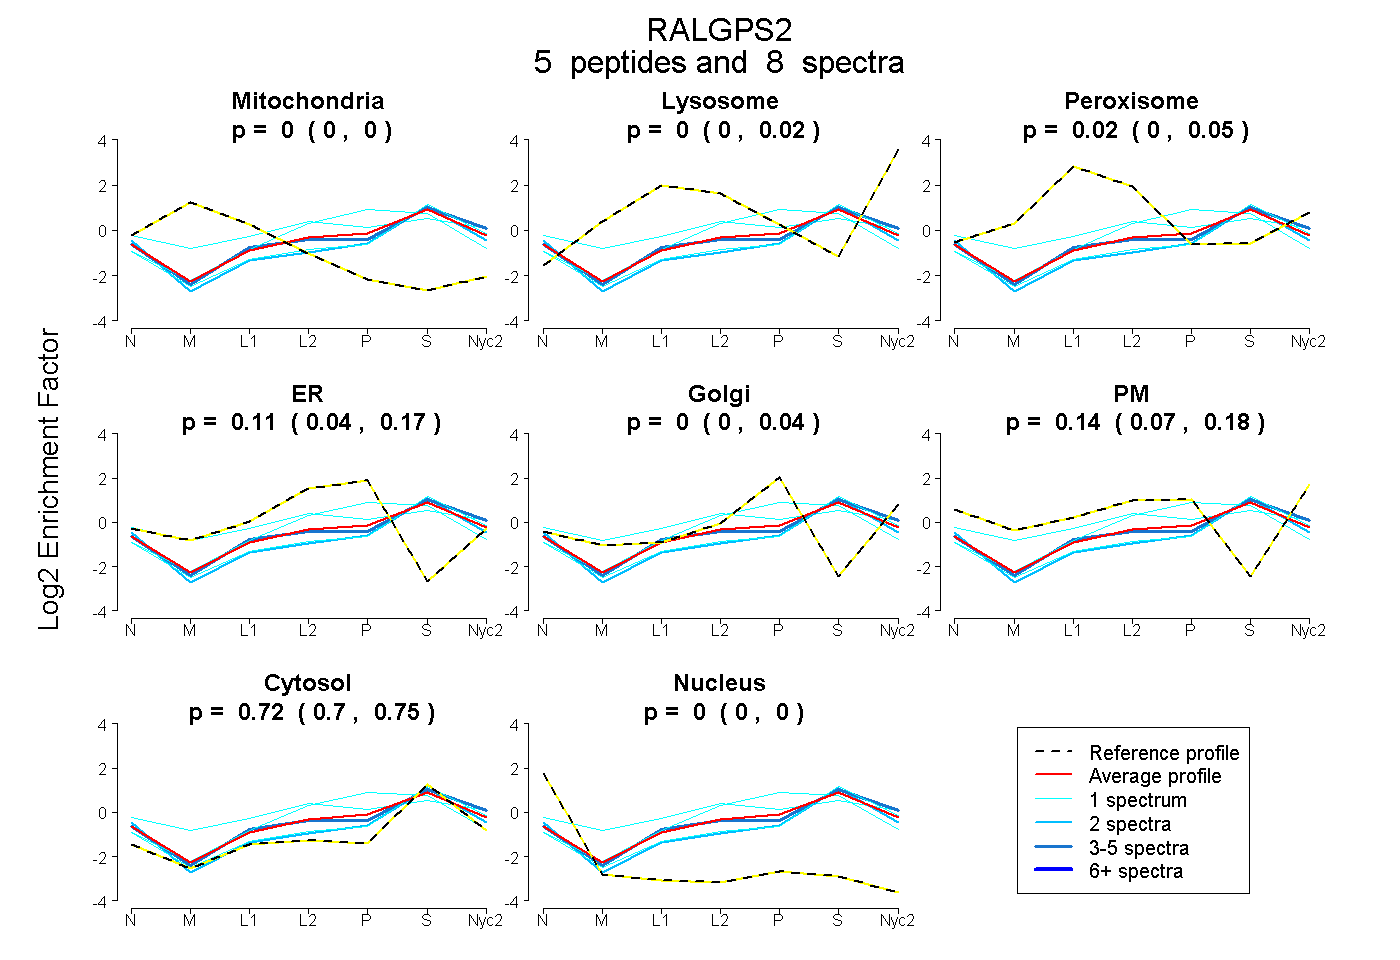
0.000 | 0.000
0.000 | 0.024
0.000 | 0.054
0.043 | 0.168
0.000 | 0.044
0.067 | 0.183
0.696 | 0.746
0.000 | 0.000
1peptide
spectrum
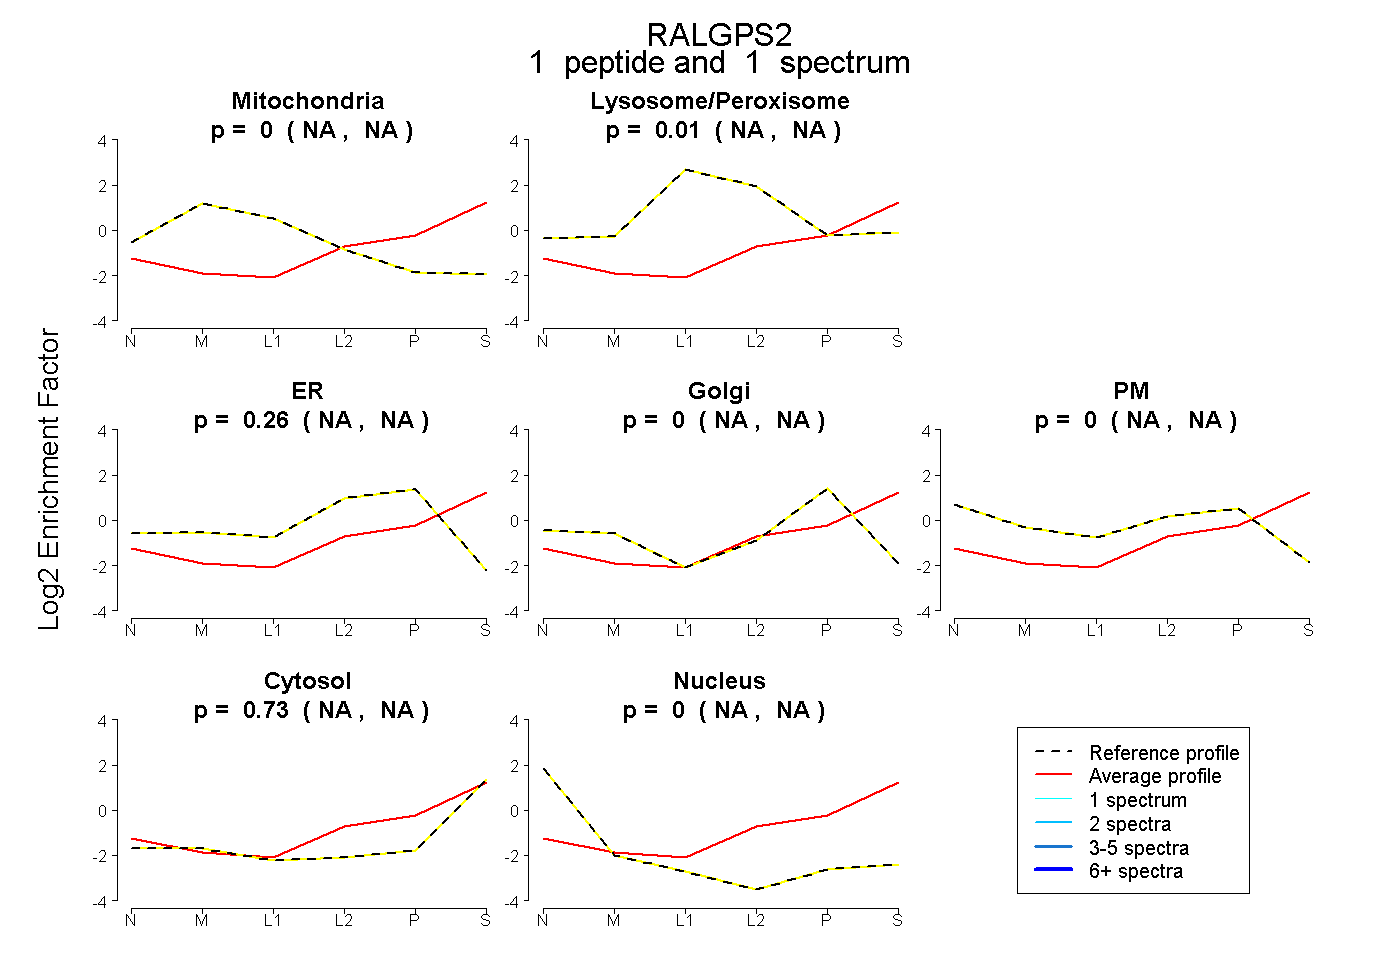
NA | NA
NA | NA
NA | NA
NA | NA
NA | NA
NA | NA
NA | NA
2peptides
spectra
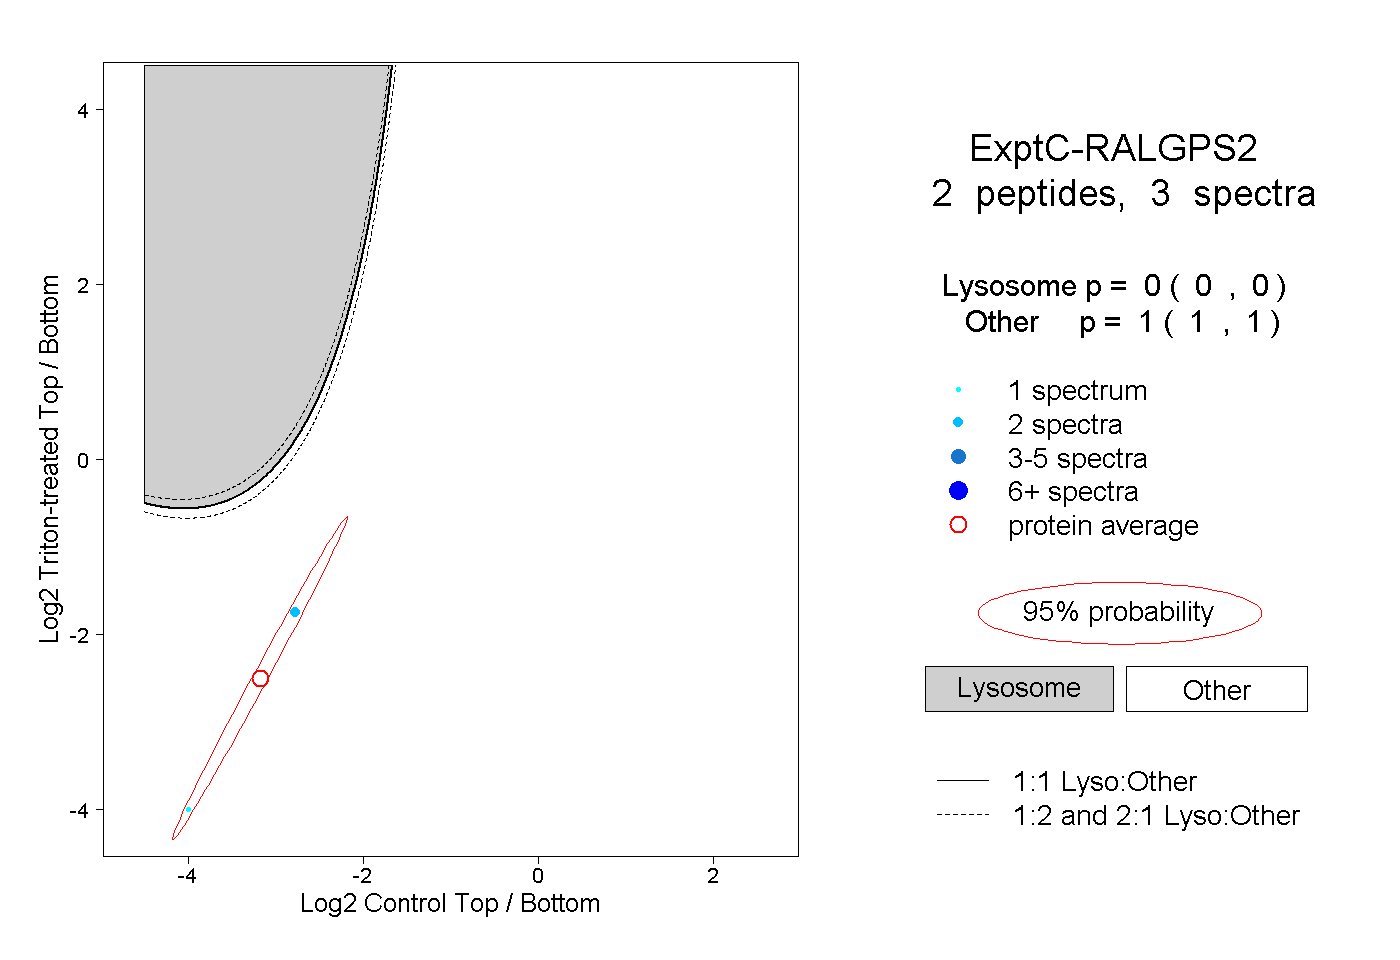
0.000 | 0.000
1.000 | 1.000