 5
5peptides
spectra
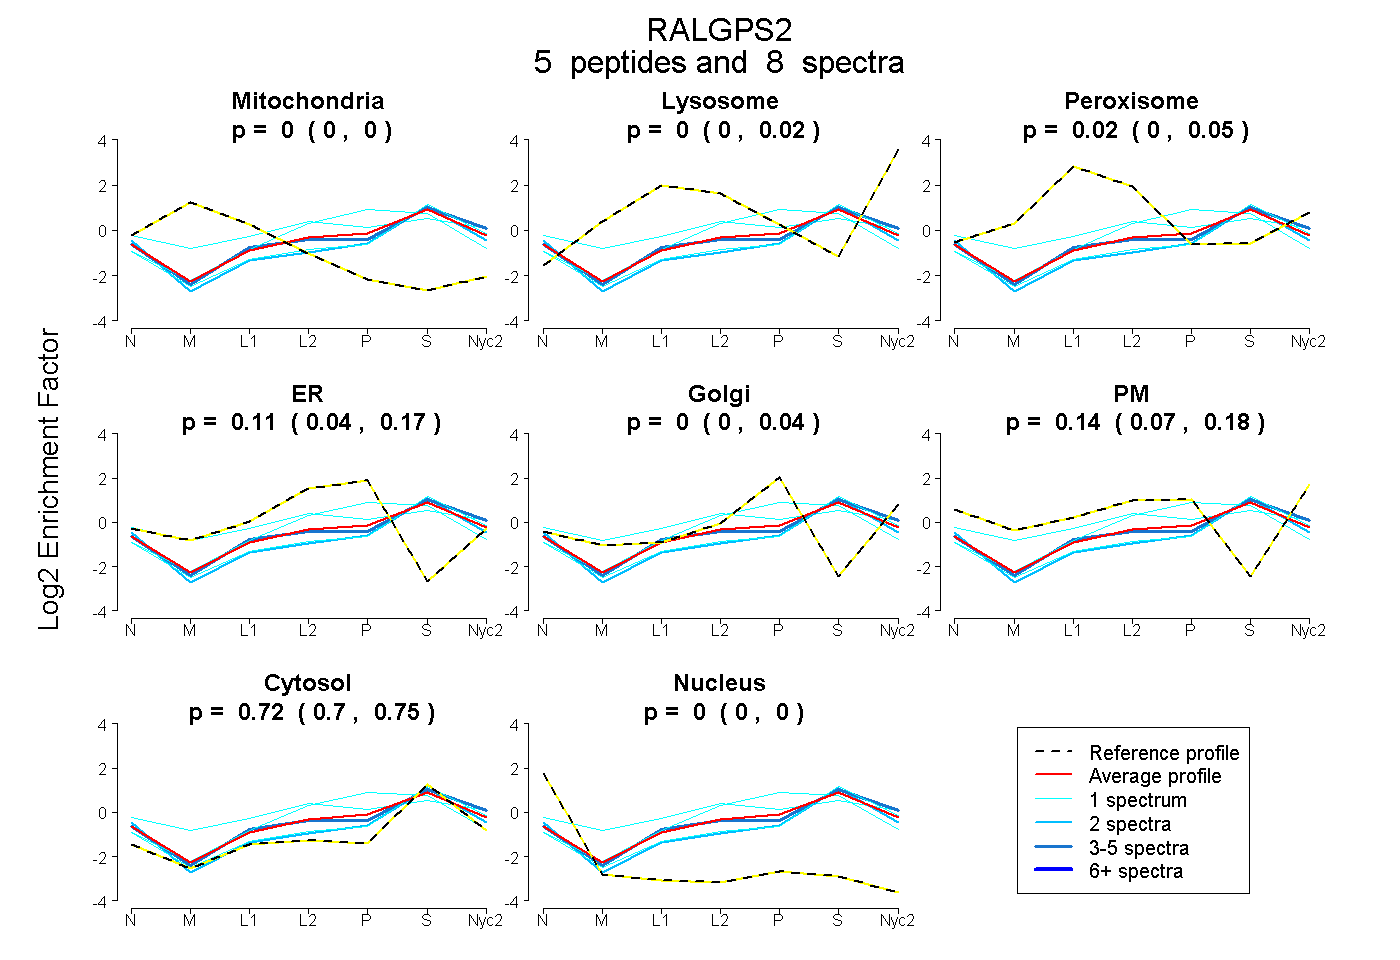
0.000 | 0.000
0.000 | 0.024
0.000 | 0.054
0.043 | 0.168
0.000 | 0.044
0.067 | 0.183
0.696 | 0.746
0.000 | 0.000
| Plot | Mito | Lyso | Perox | ER | Golgi | PM | Cytosol | Nucleus | |||||
| Expt A |
5 peptides |
8 spectra |
|
0.000 0.000 | 0.000 |
0.000 0.000 | 0.024 |
0.021 0.000 | 0.054 |
0.114 0.043 | 0.168 |
0.000 0.000 | 0.044 |
0.141 0.067 | 0.183 |
0.725 0.696 | 0.746 |
0.000 0.000 | 0.000 |
| 2 spectra, FVEDDNYK | 0.000 | 0.000 | 0.000 | 0.000 | 0.050 | 0.102 | 0.837 | 0.011 | ||
| 1 spectrum, YSSAPNAVAFTR | 0.000 | 0.012 | 0.000 | 0.000 | 0.040 | 0.101 | 0.847 | 0.000 | ||
| 1 spectrum, EDLAGPDVGASPQGGR | 0.000 | 0.000 | 0.228 | 0.076 | 0.000 | 0.223 | 0.473 | 0.000 | ||
| 1 spectrum, SFDAVVFDVLK | 0.000 | 0.000 | 0.000 | 0.391 | 0.000 | 0.000 | 0.609 | 0.000 | ||
| 3 spectra, HLIPHGHR | 0.000 | 0.042 | 0.030 | 0.000 | 0.000 | 0.182 | 0.746 | 0.000 |
| Plot | Mito | Lyso or Perox | ER | Golgi | PM | Cytosol | Nucleus | ||||||
| Expt B |
1 peptide |
1 spectrum |
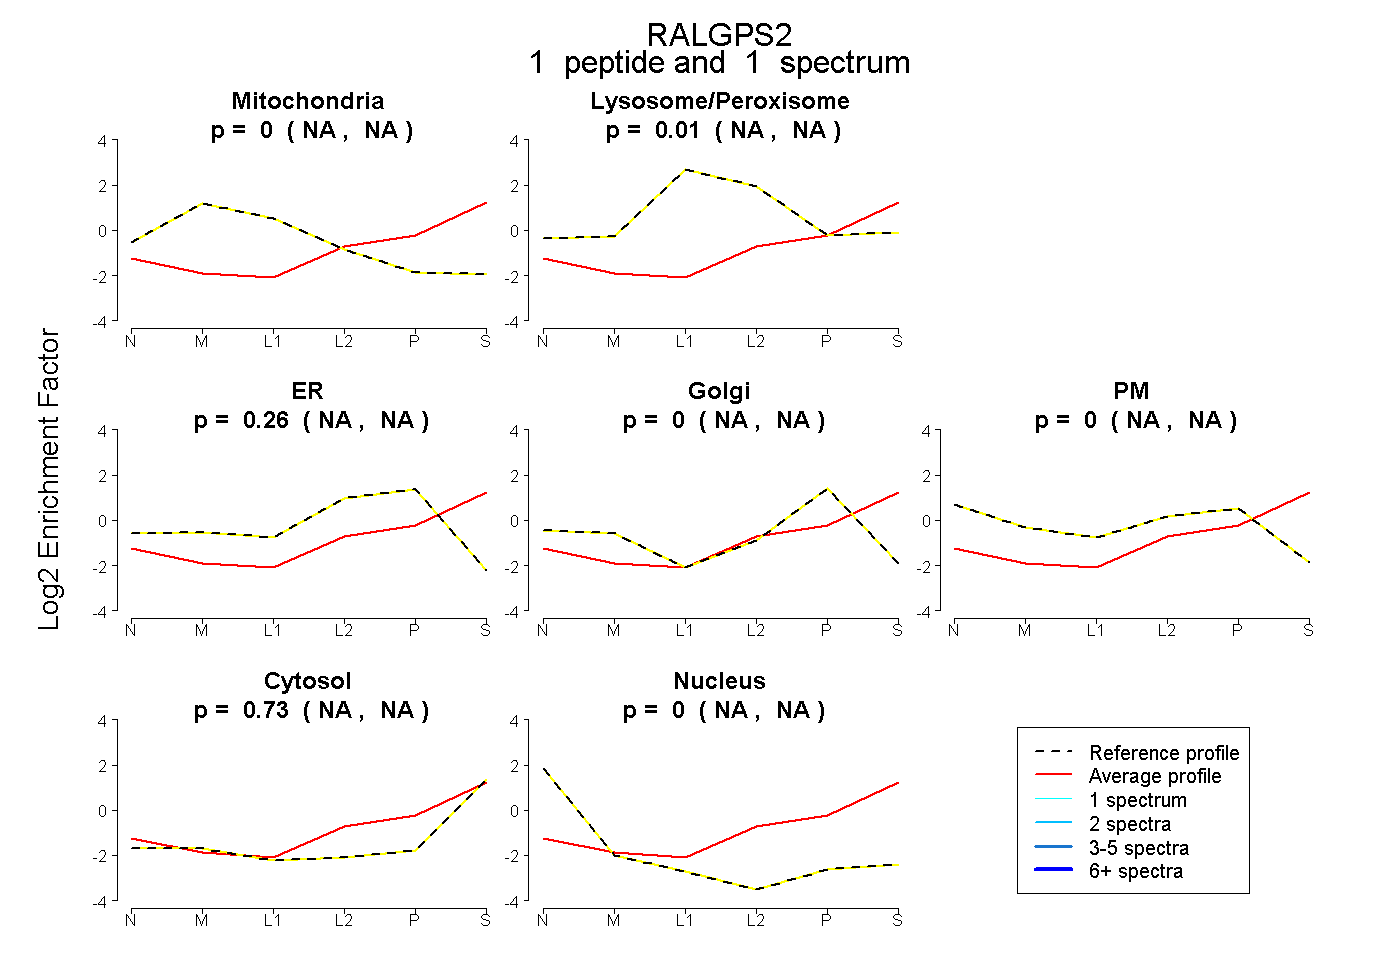 |
0.000 NA | NA |
0.009 NA | NA |
0.265 NA | NA |
0.000 NA | NA |
0.000 NA | NA |
0.726 NA | NA |
0.000 NA | NA |
|||
| Plot | Lyso | Other | |||||||||||
| Expt C |
2 peptides |
3 spectra |
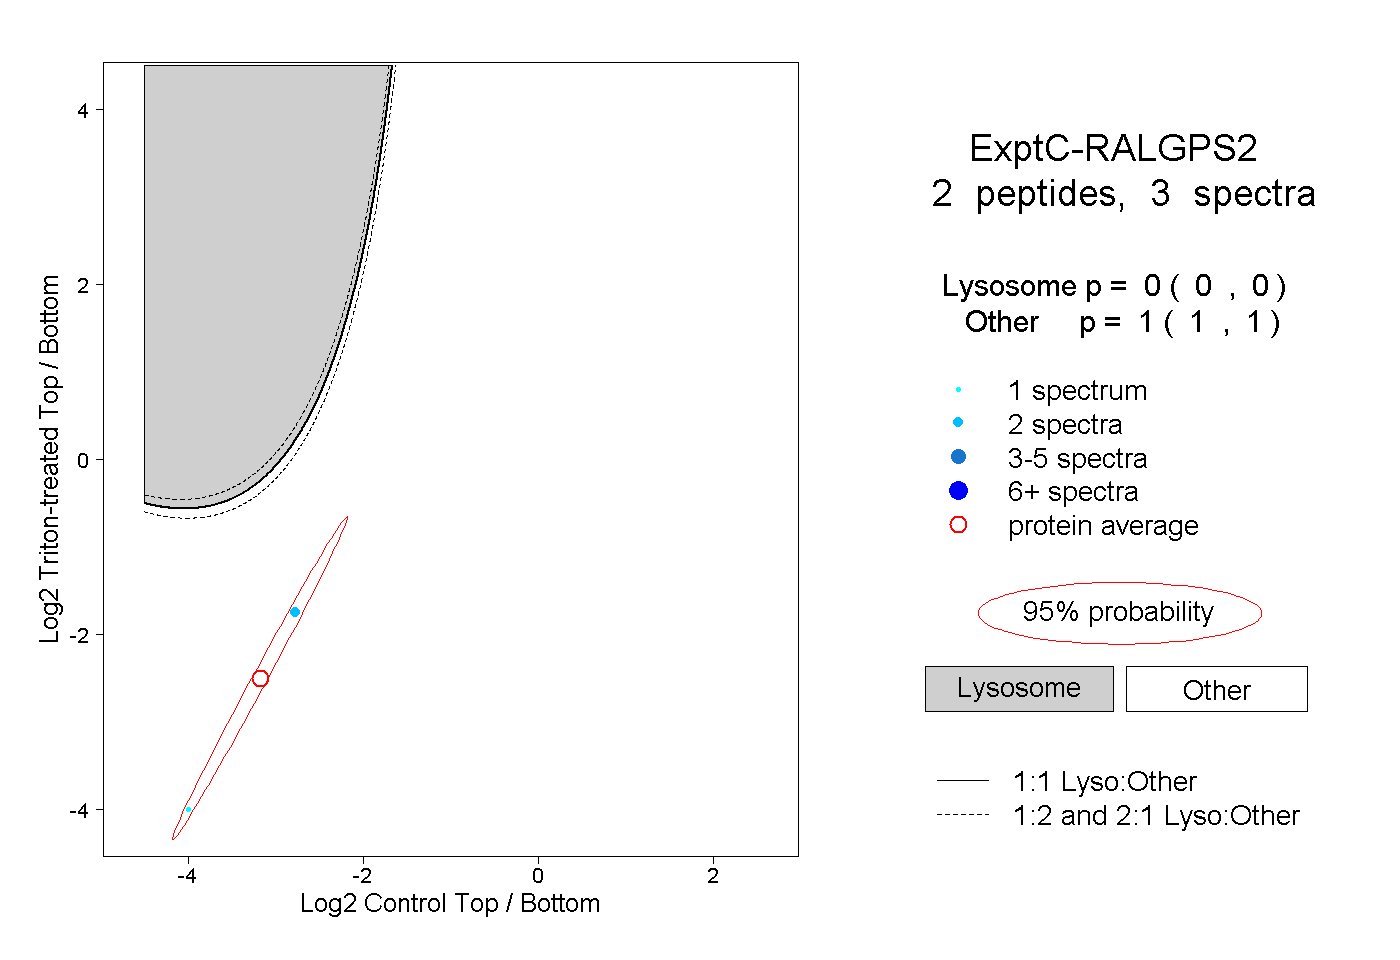 |
0.000 0.000 | 0.000 |
1.000 1.000 | 1.000 |