 6
6peptides
spectra
0.000 | 0.000
0.052 | 0.117
0.086 | 0.146
0.000 | 0.000
0.365 | 0.397
0.000 | 0.000
0.393 | 0.425
0.000 | 0.000
4peptides
spectra
0.000 | 0.000
1.000 | 1.000
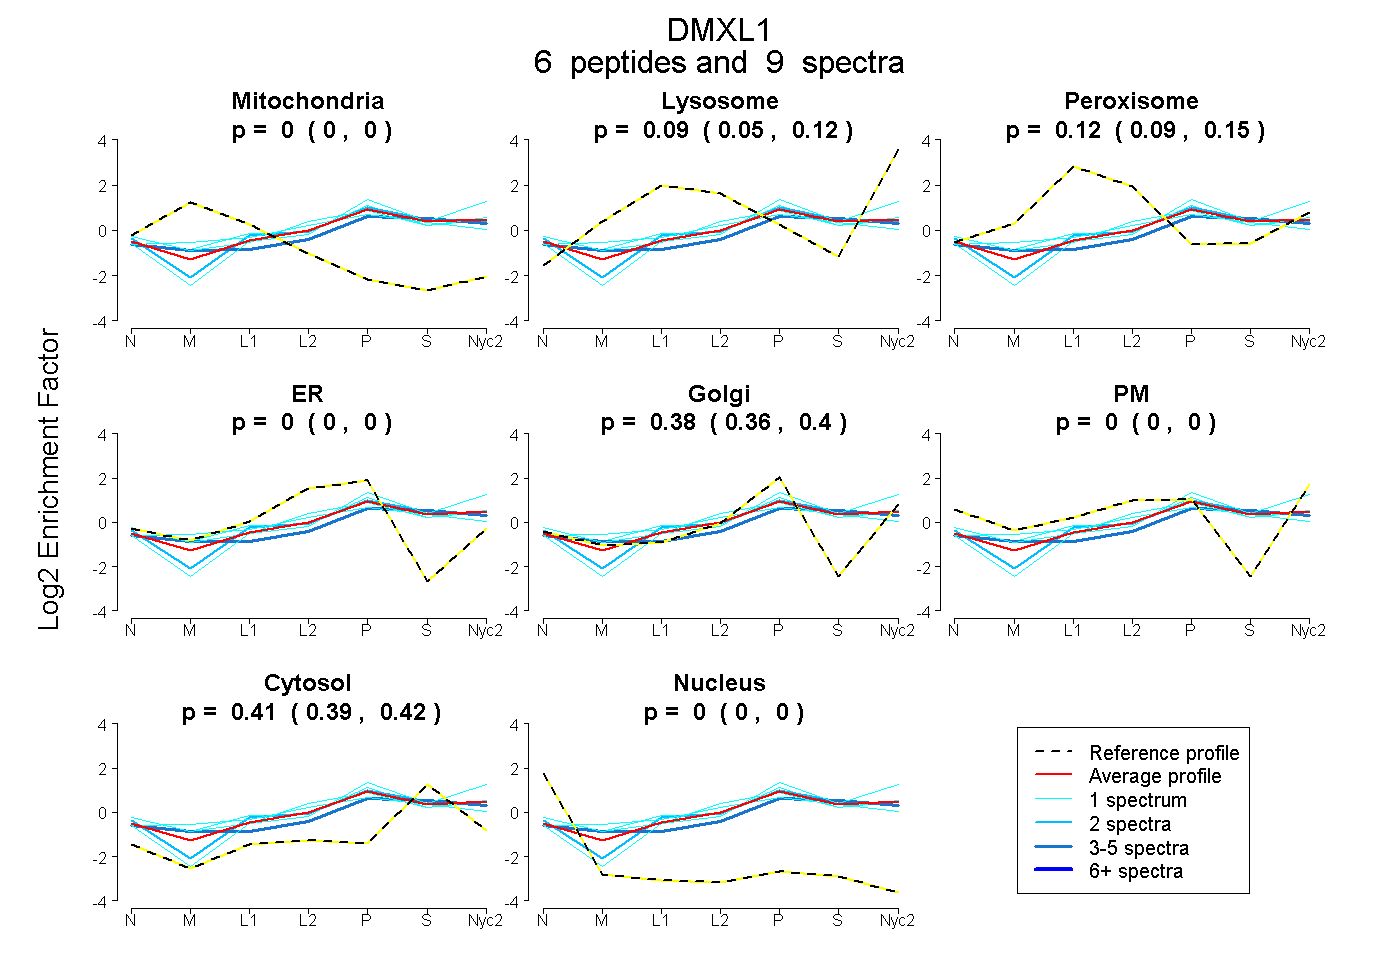
| Plot | Mito | Lyso | Perox | ER | Golgi | PM | Cytosol | Nucleus | |||||
| Expt A |
6 peptides |
9 spectra |
|
0.000 0.000 | 0.000 |
0.088 0.052 | 0.117 |
0.120 0.086 | 0.146 |
0.000 0.000 | 0.000 |
0.383 0.365 | 0.397 |
0.000 0.000 | 0.000 |
0.409 0.393 | 0.425 |
0.000 0.000 | 0.000 |
||
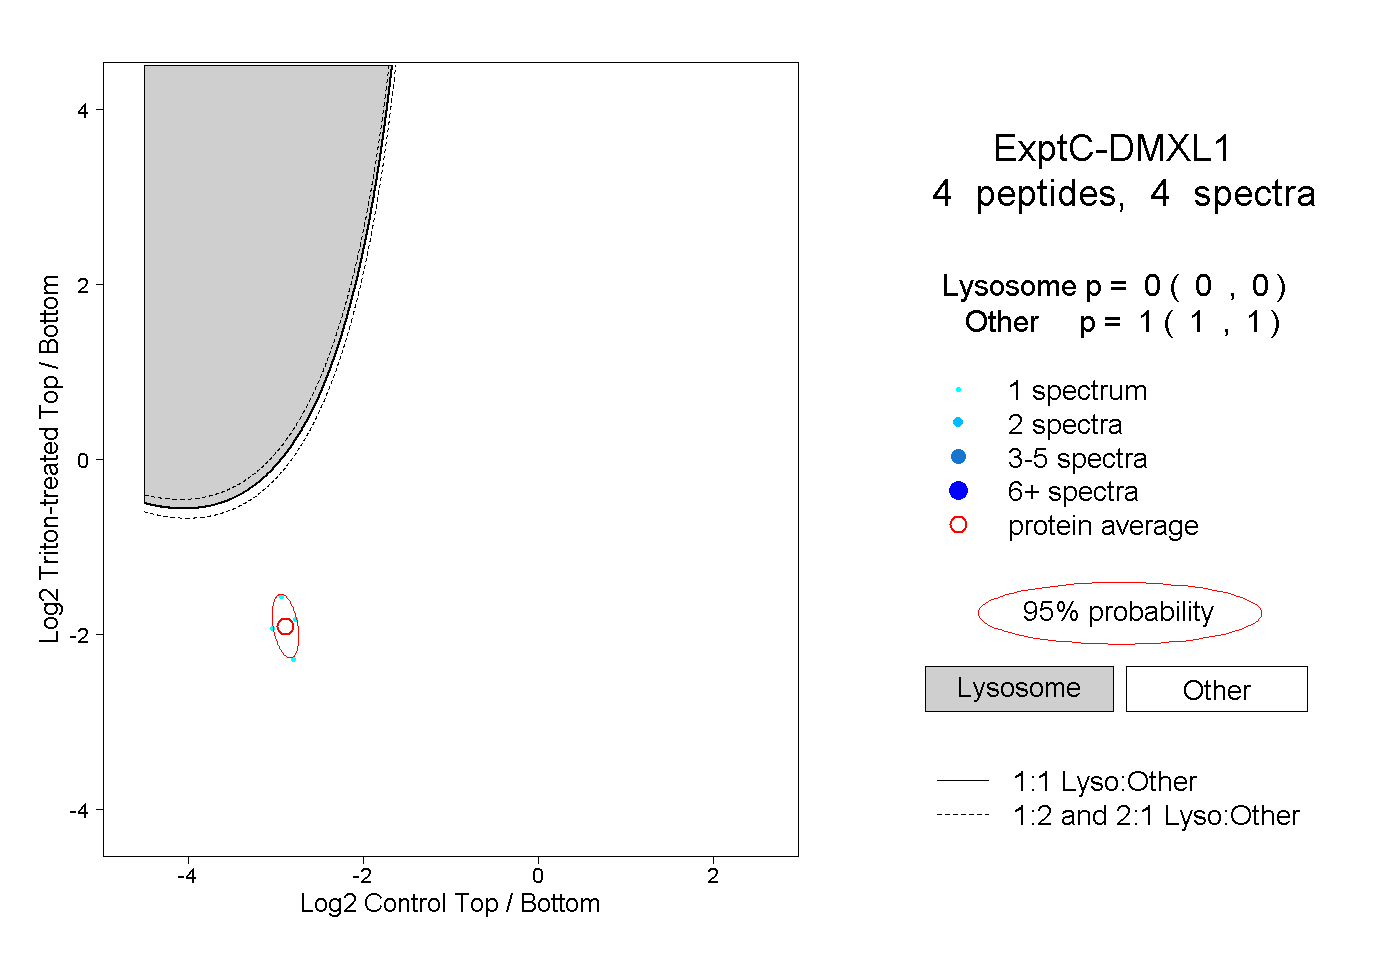
| Plot | Lyso | Other | |||||||||||
| Expt C |
4 peptides |
4 spectra |
|
0.000 0.000 | 0.000 |
1.000 1.000 | 1.000 |