 6
6peptides
spectra
0.000 | 0.000
0.052 | 0.117
0.086 | 0.146
0.000 | 0.000
0.365 | 0.397
0.000 | 0.000
0.393 | 0.425
0.000 | 0.000
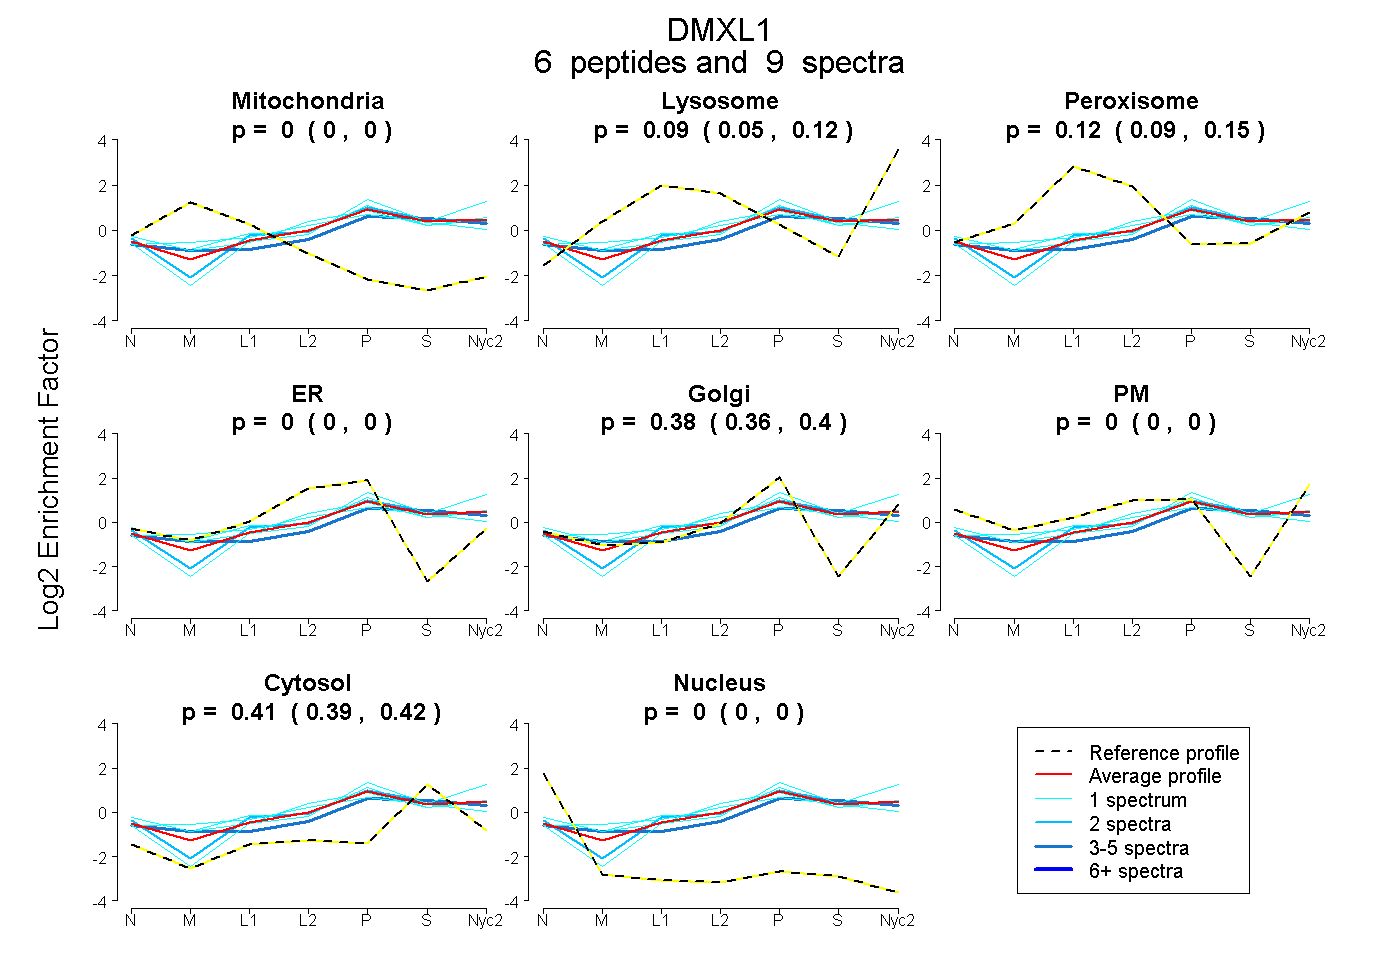
| Plot | Mito | Lyso | Perox | ER | Golgi | PM | Cytosol | Nucleus | |||||
| Expt A |
6 peptides |
9 spectra |
|
0.000 0.000 | 0.000 |
0.088 0.052 | 0.117 |
0.120 0.086 | 0.146 |
0.000 0.000 | 0.000 |
0.383 0.365 | 0.397 |
0.000 0.000 | 0.000 |
0.409 0.393 | 0.425 |
0.000 0.000 | 0.000 |
| 3 spectra, LFESEFDK | 0.000 | 0.093 | 0.070 | 0.000 | 0.346 | 0.000 | 0.490 | 0.000 | ||
| 2 spectra, HQLLISGGR | 0.000 | 0.003 | 0.164 | 0.000 | 0.392 | 0.000 | 0.441 | 0.000 | ||
| 1 spectrum, QEEIQETFIR | 0.000 | 0.051 | 0.126 | 0.023 | 0.246 | 0.188 | 0.365 | 0.000 | ||
| 1 spectrum, MWDLHLR | 0.000 | 0.169 | 0.000 | 0.000 | 0.408 | 0.000 | 0.423 | 0.000 | ||
| 1 spectrum, LYEAVIDAK | 0.000 | 0.000 | 0.282 | 0.017 | 0.329 | 0.000 | 0.372 | 0.000 | ||
| 1 spectrum, DDCLLK | 0.000 | 0.087 | 0.168 | 0.000 | 0.402 | 0.000 | 0.343 | 0.000 |
| Plot | Lyso | Other | |||||||||||
| Expt C |
4 peptides |
4 spectra |
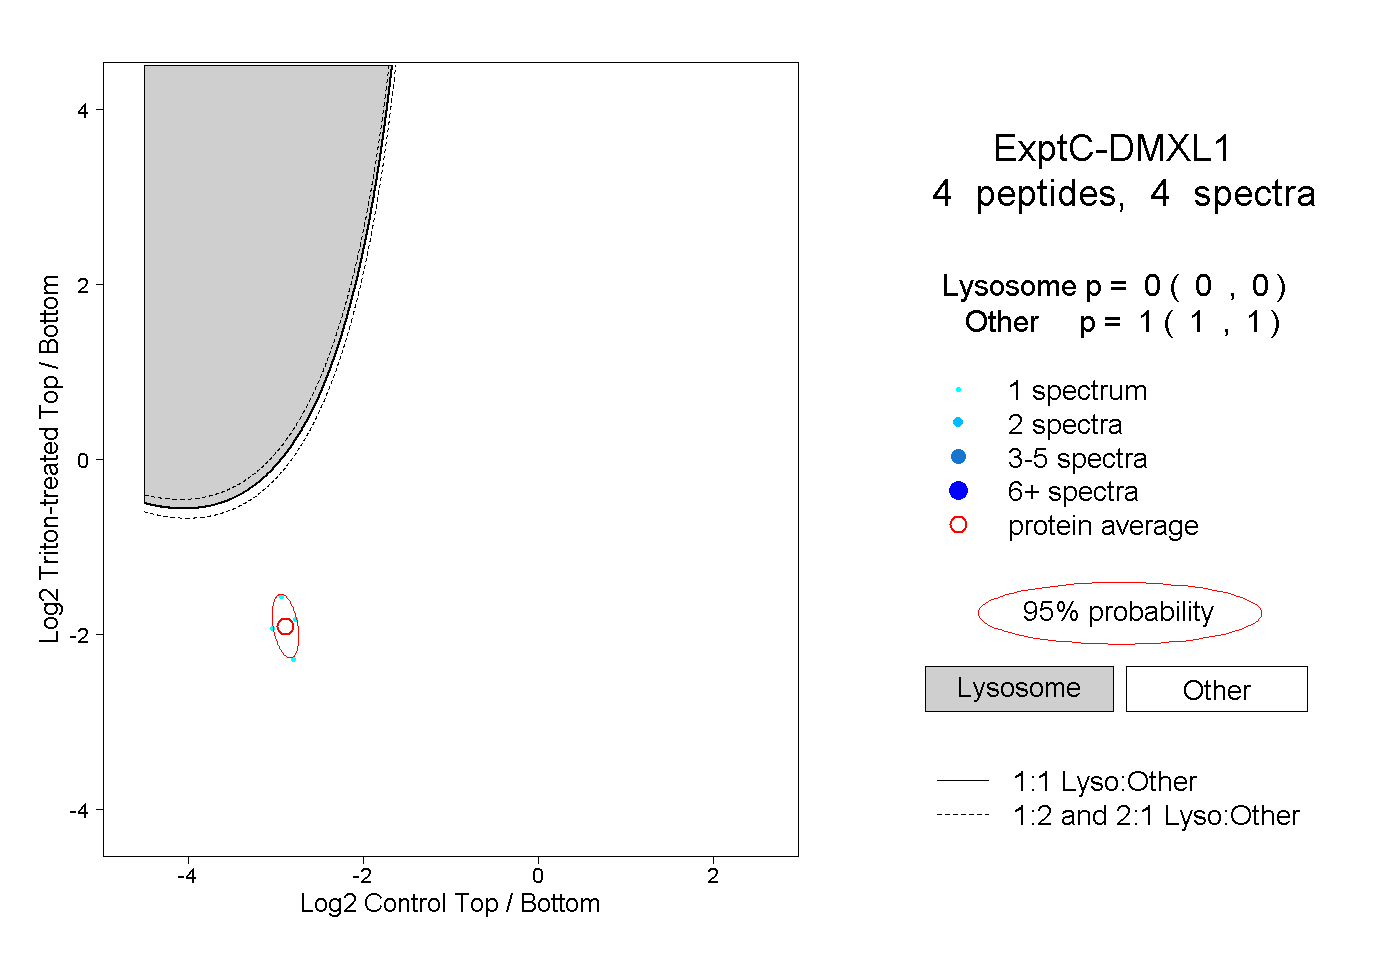 |
0.000 0.000 | 0.000 |
1.000 1.000 | 1.000 |