 7
7peptides
spectra
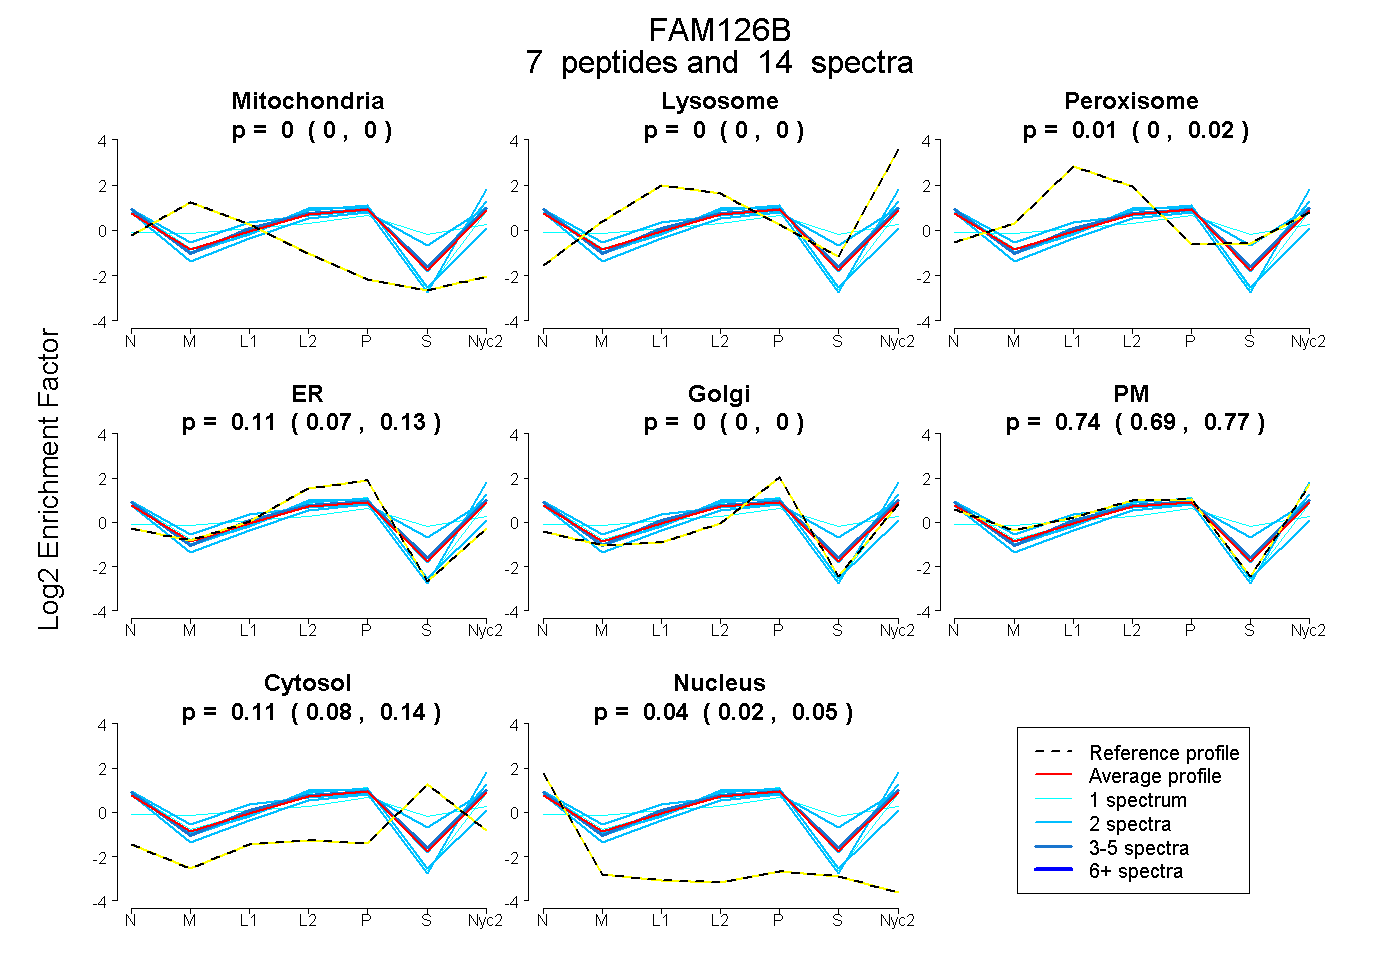
0.000 | 0.000
0.000 | 0.000
0.000 | 0.023
0.066 | 0.133
0.000 | 0.000
0.694 | 0.774
0.076 | 0.135
0.021 | 0.054
2peptides
spectra
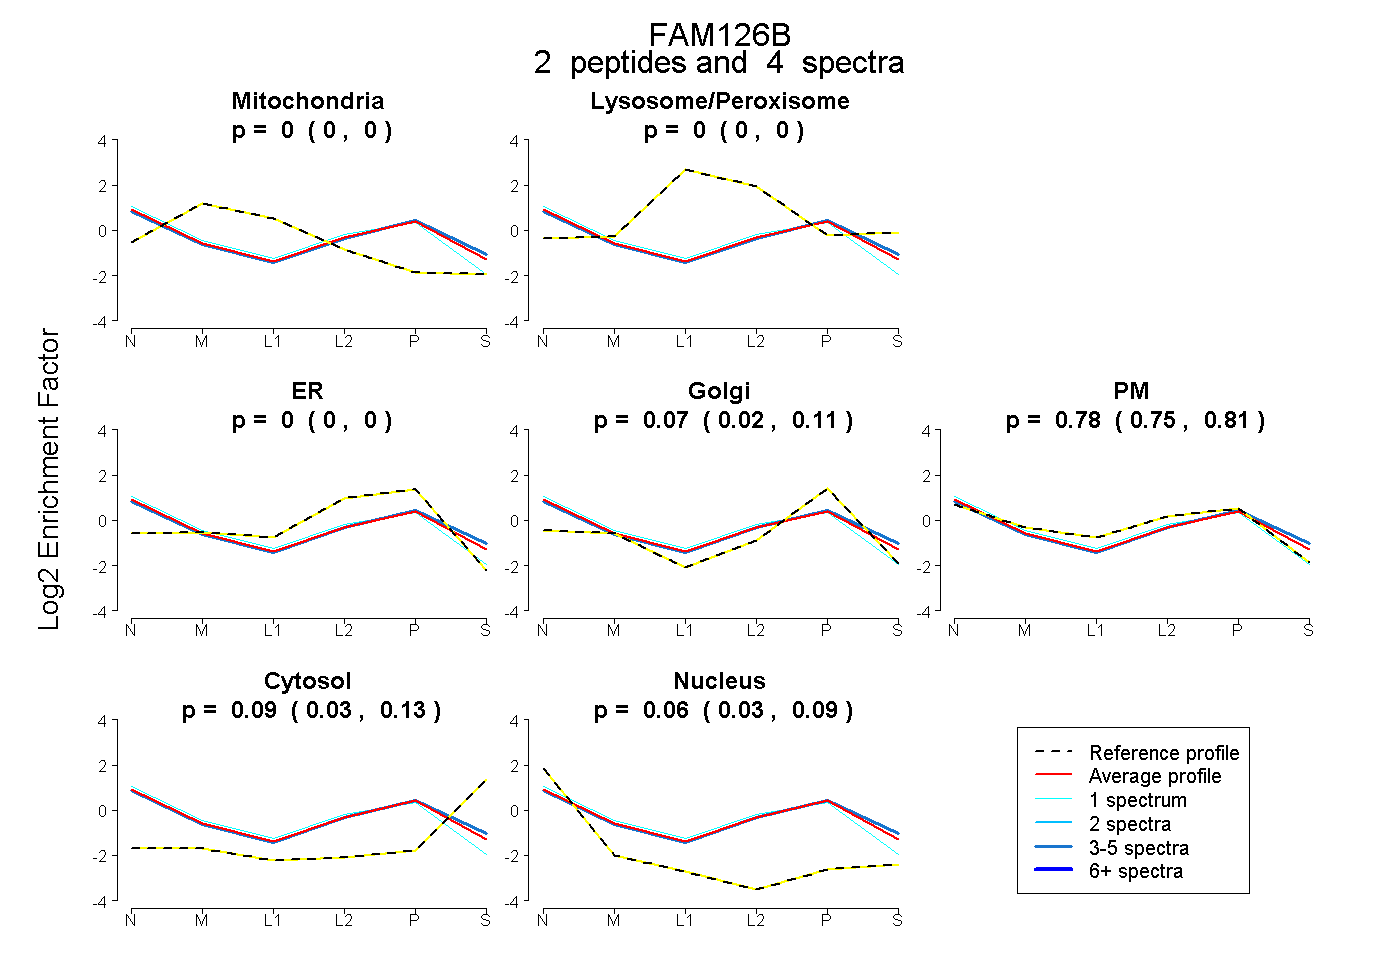
0.000 | 0.000
0.000 | 0.000
0.000 | 0.000
0.015 | 0.110
0.750 | 0.811
0.030 | 0.132
0.034 | 0.088
2peptides
spectra
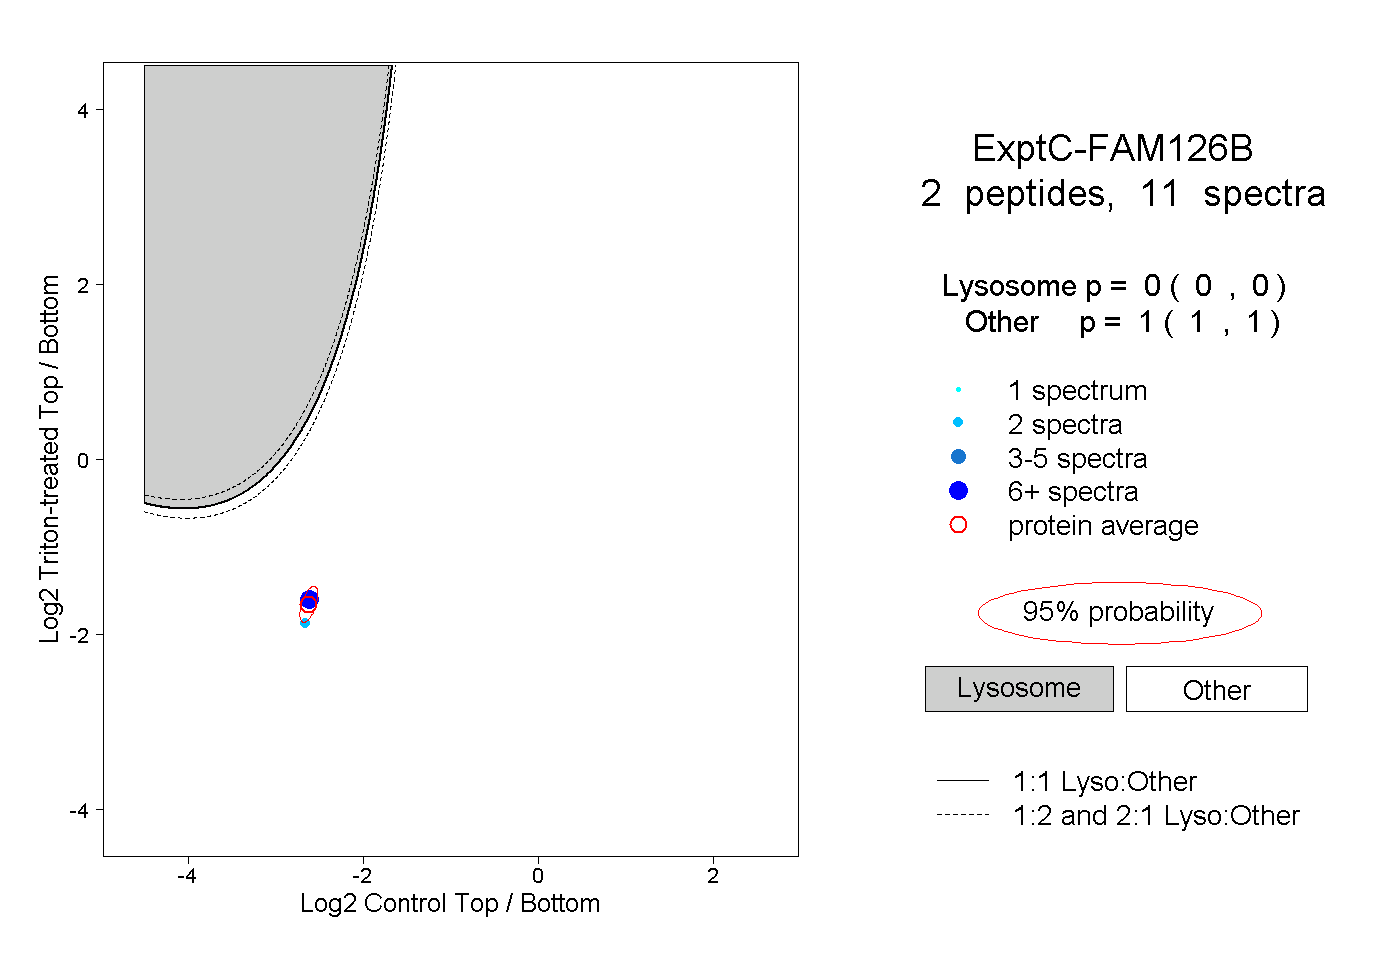
0.000 | 0.000
1.000 | 1.000
2peptides
spectra
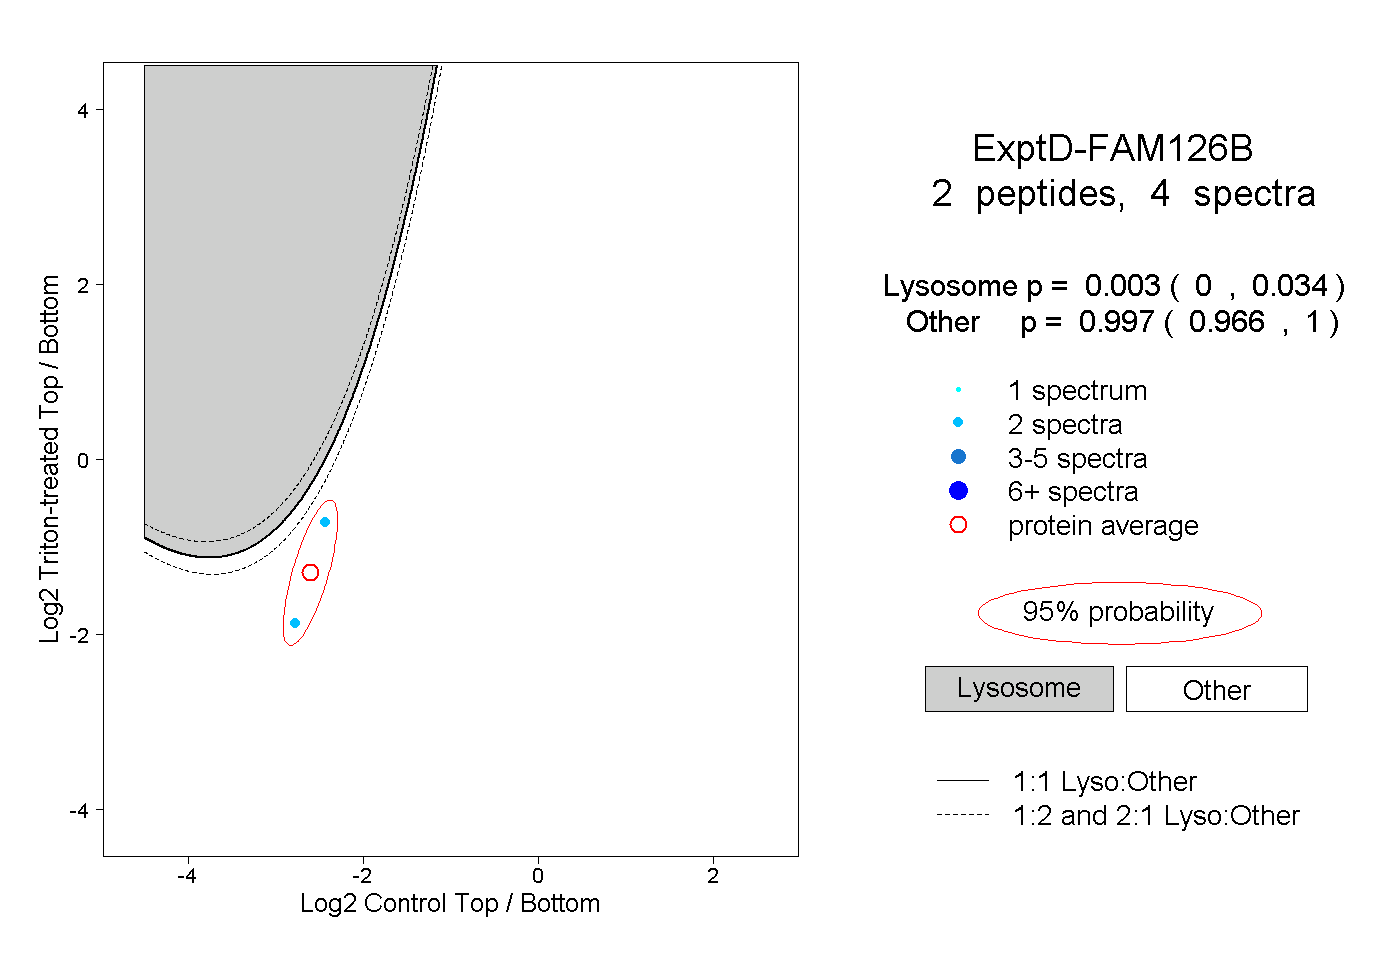
0.000 | 0.034
0.966 | 1.000