 7
7peptides
spectra
0.000 | 0.000
0.000 | 0.000
0.000 | 0.023
0.066 | 0.133
0.000 | 0.000
0.694 | 0.774
0.076 | 0.135
0.021 | 0.054
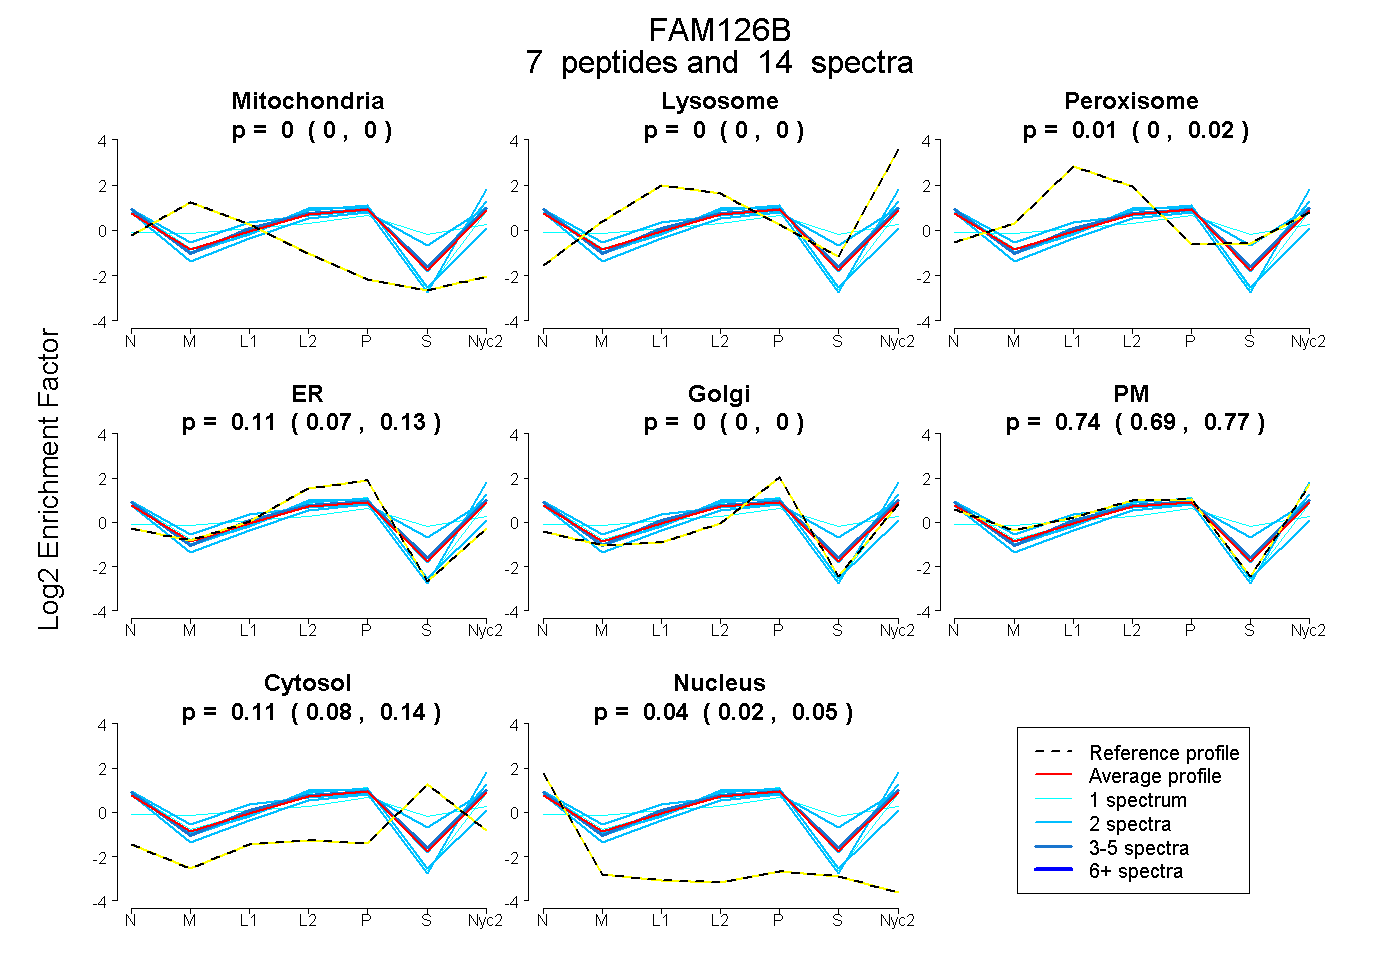
| Plot | Mito | Lyso | Perox | ER | Golgi | PM | Cytosol | Nucleus | |||||
| Expt A |
7 peptides |
14 spectra |
|
0.000 0.000 | 0.000 |
0.000 0.000 | 0.000 |
0.009 0.000 | 0.023 |
0.106 0.066 | 0.133 |
0.000 0.000 | 0.000 |
0.737 0.694 | 0.774 |
0.109 0.076 | 0.135 |
0.040 0.021 | 0.054 |
| 2 spectra, ETFTAQNR | 0.000 | 0.000 | 0.000 | 0.000 | 0.000 | 0.703 | 0.297 | 0.000 | ||
| 2 spectra, VCVSGFPR | 0.000 | 0.000 | 0.000 | 0.415 | 0.000 | 0.458 | 0.000 | 0.127 | ||
| 2 spectra, TAITTASIR | 0.000 | 0.000 | 0.000 | 0.042 | 0.000 | 0.842 | 0.095 | 0.021 | ||
| 4 spectra, VEVTPTVPR | 0.000 | 0.000 | 0.016 | 0.062 | 0.000 | 0.769 | 0.123 | 0.029 | ||
| 2 spectra, ALVPALYK | 0.000 | 0.000 | 0.000 | 0.000 | 0.000 | 0.973 | 0.000 | 0.027 | ||
| 1 spectrum, ALPDTQITSYAATLHR | 0.012 | 0.000 | 0.325 | 0.000 | 0.310 | 0.106 | 0.247 | 0.000 | ||
| 1 spectrum, AVVEEWLSEFK | 0.000 | 0.000 | 0.000 | 0.205 | 0.000 | 0.719 | 0.000 | 0.077 |
| Plot | Mito | Lyso or Perox | ER | Golgi | PM | Cytosol | Nucleus | ||||||
| Expt B |
2 peptides |
4 spectra |
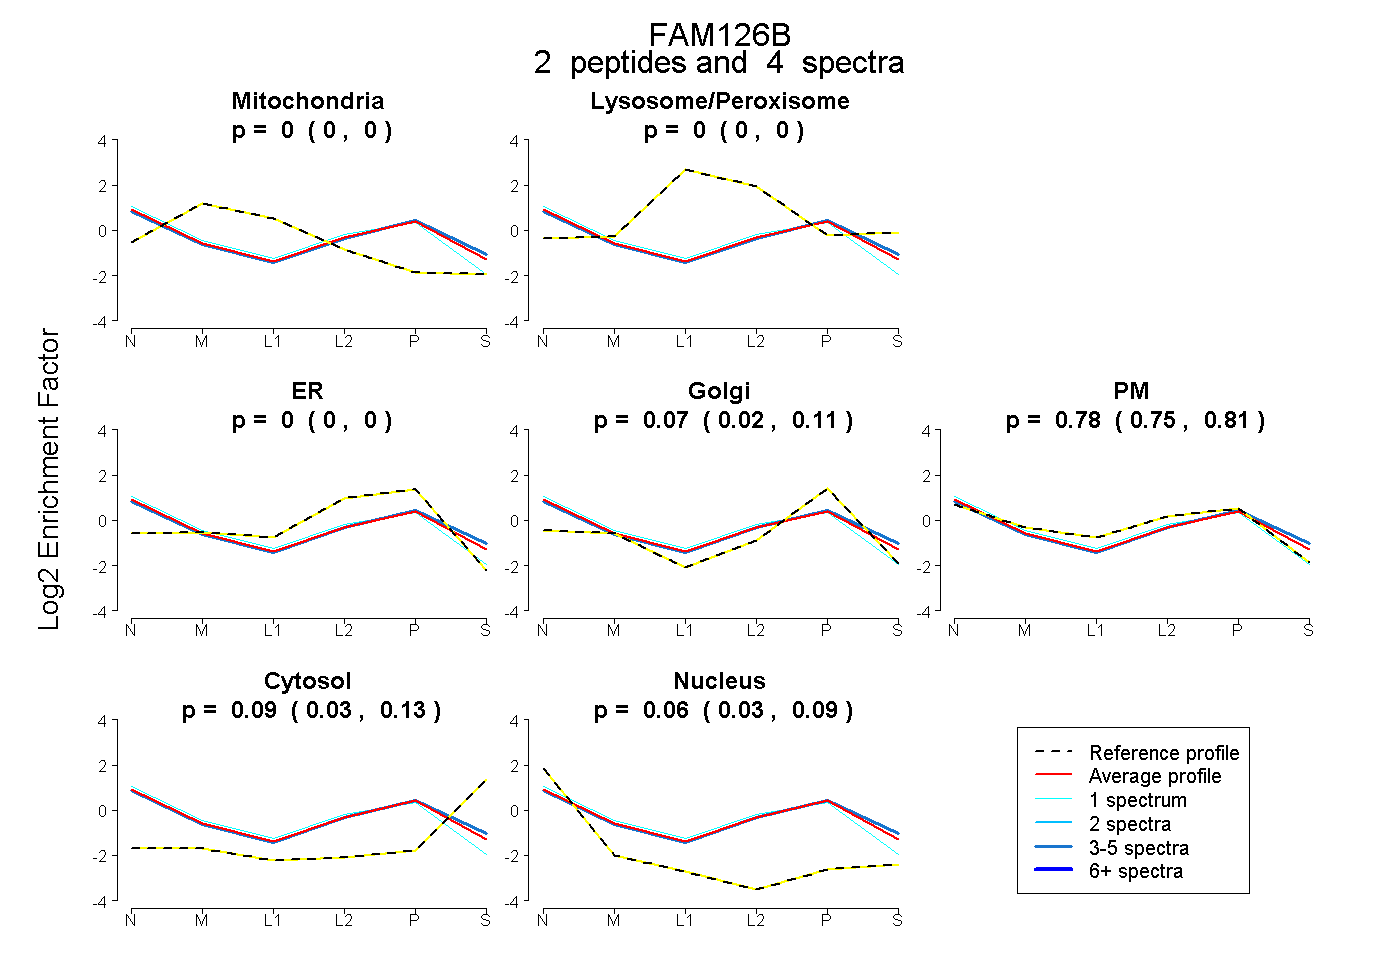 |
0.000 0.000 | 0.000 |
0.000 0.000 | 0.000 |
0.000 0.000 | 0.000 |
0.070 0.015 | 0.110 |
0.781 0.750 | 0.811 |
0.085 0.030 | 0.132 |
0.064 0.034 | 0.088 |
|||
| Plot | Lyso | Other | |||||||||||
| Expt C |
2 peptides |
11 spectra |
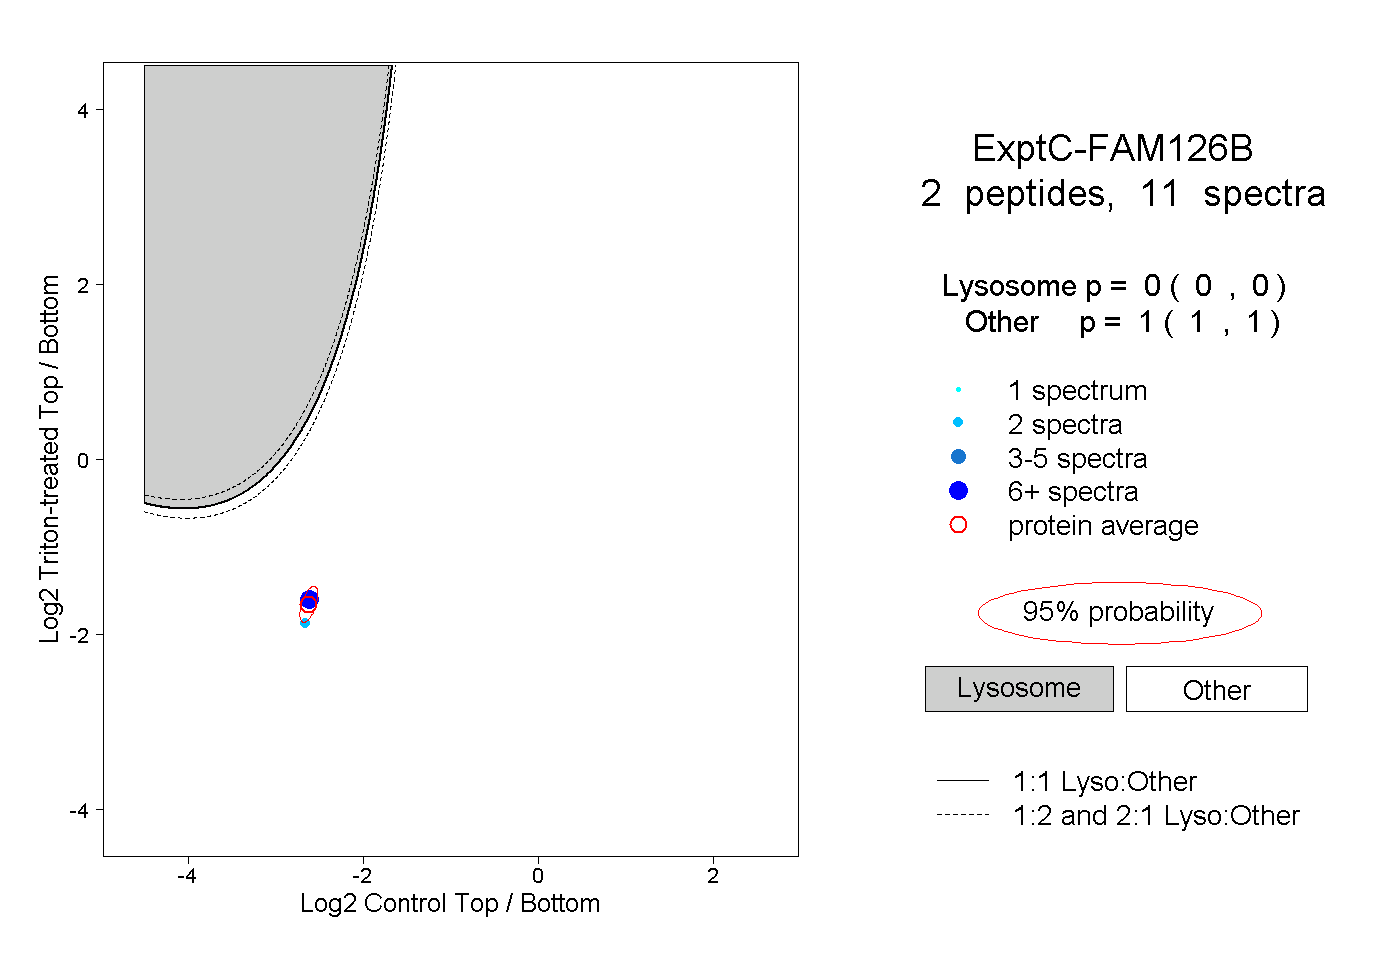 |
0.000 0.000 | 0.000 |
1.000 1.000 | 1.000 |
||||||||
| Plot | Lyso | Other | |||||||||||
| Expt D |
2 peptides |
4 spectra |
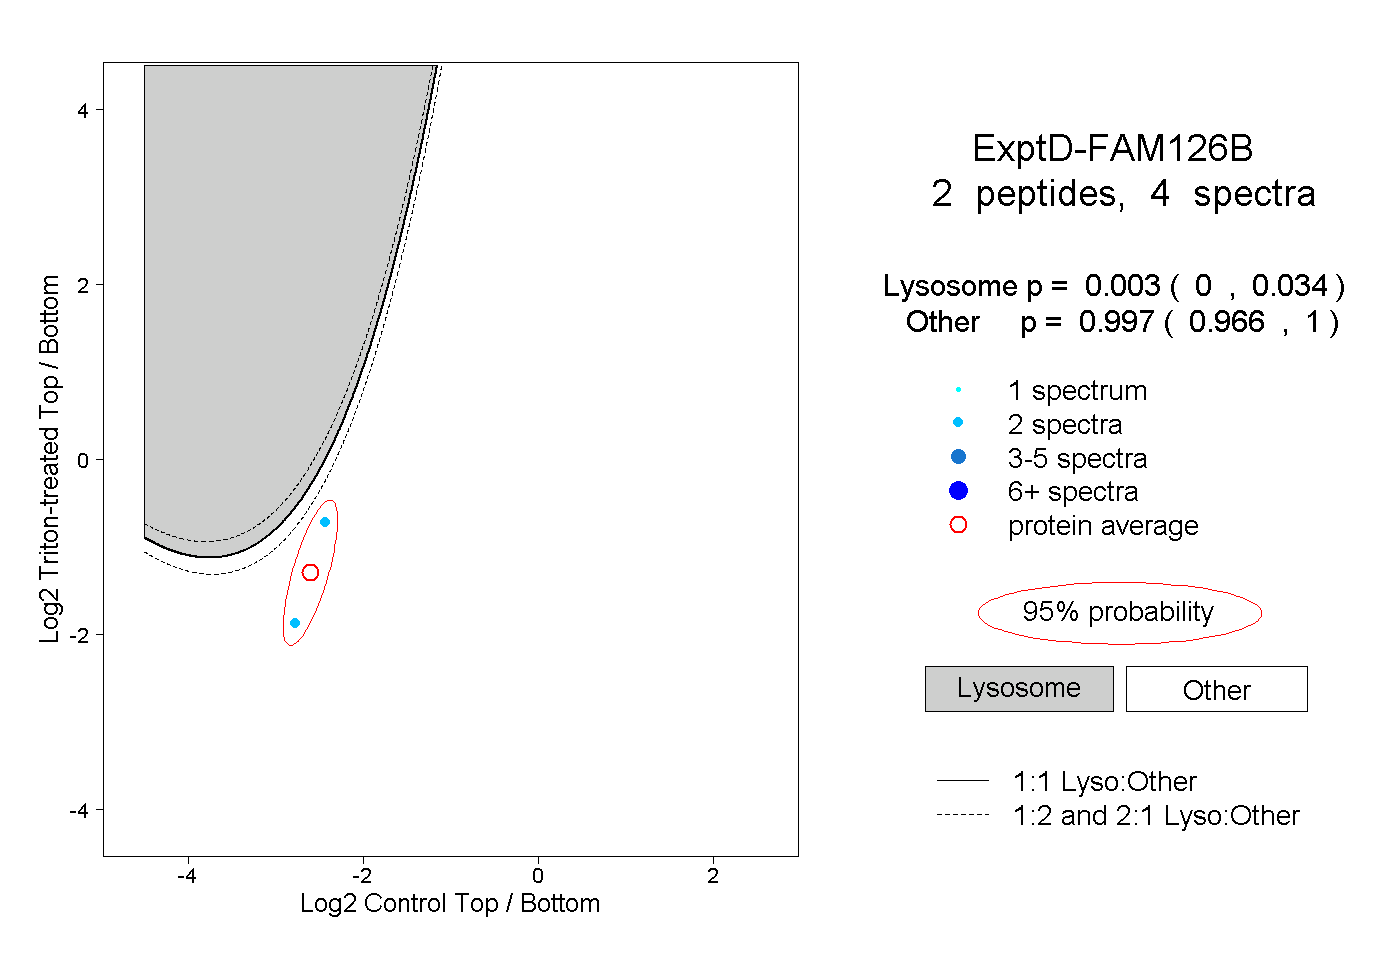 |
0.003 0.000 | 0.034 |
0.997 0.966 | 1.000 |