 8
8peptides
spectra
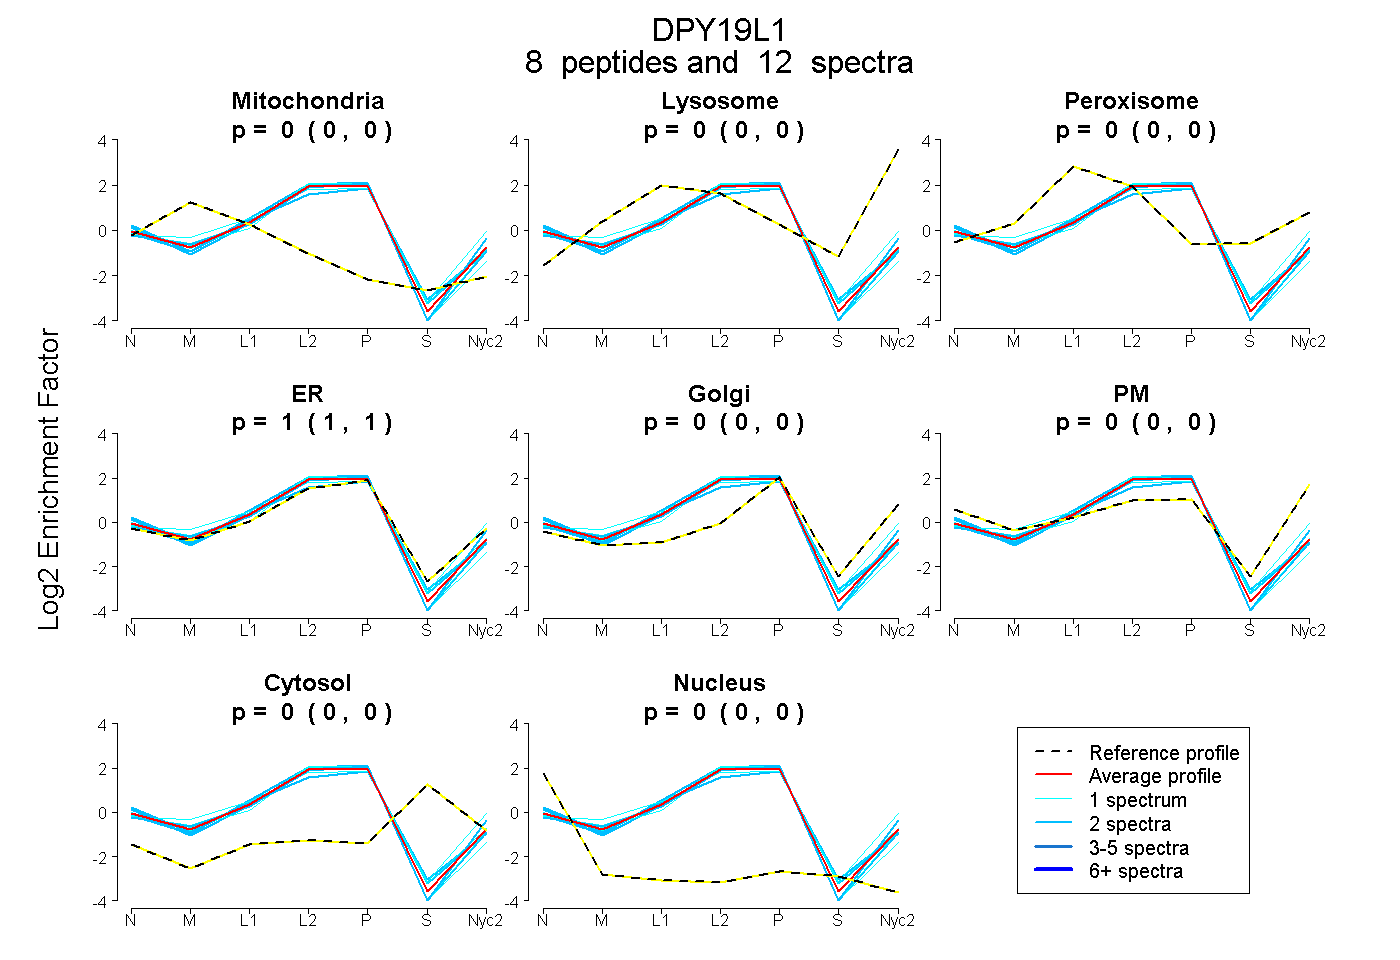
0.000 | 0.000
0.000 | 0.000
0.000 | 0.000
1.000 | 1.000
0.000 | 0.000
0.000 | 0.000
0.000 | 0.000
0.000 | 0.000
4peptides
spectra
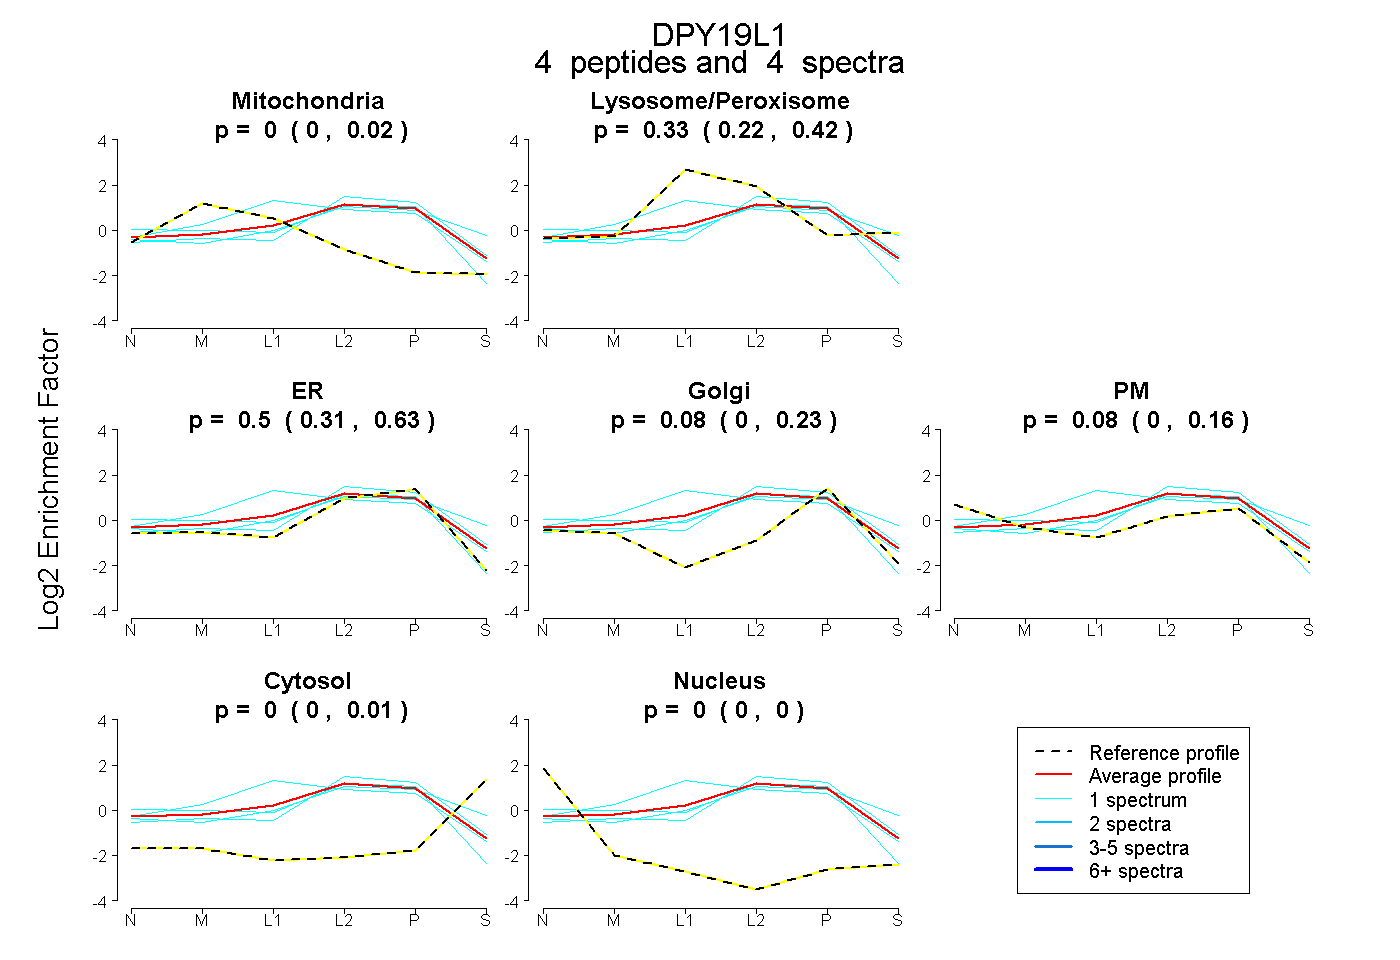
0.000 | 0.017
0.224 | 0.424
0.311 | 0.628
0.000 | 0.227
0.000 | 0.161
0.000 | 0.005
0.000 | 0.000
6peptides
spectra
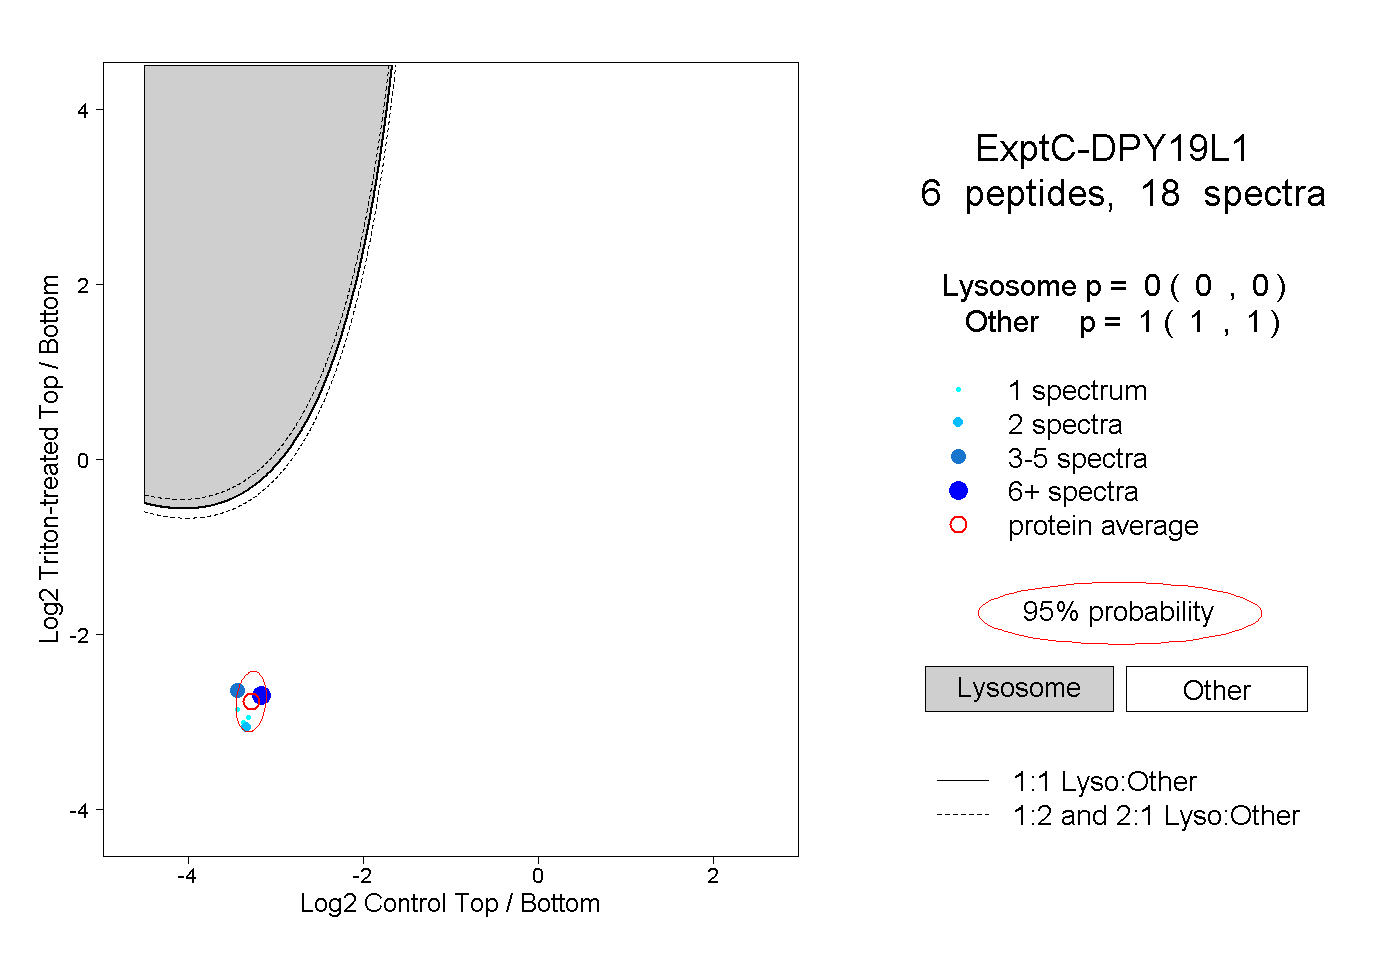
0.000 | 0.000
1.000 | 1.000
3peptides
spectra
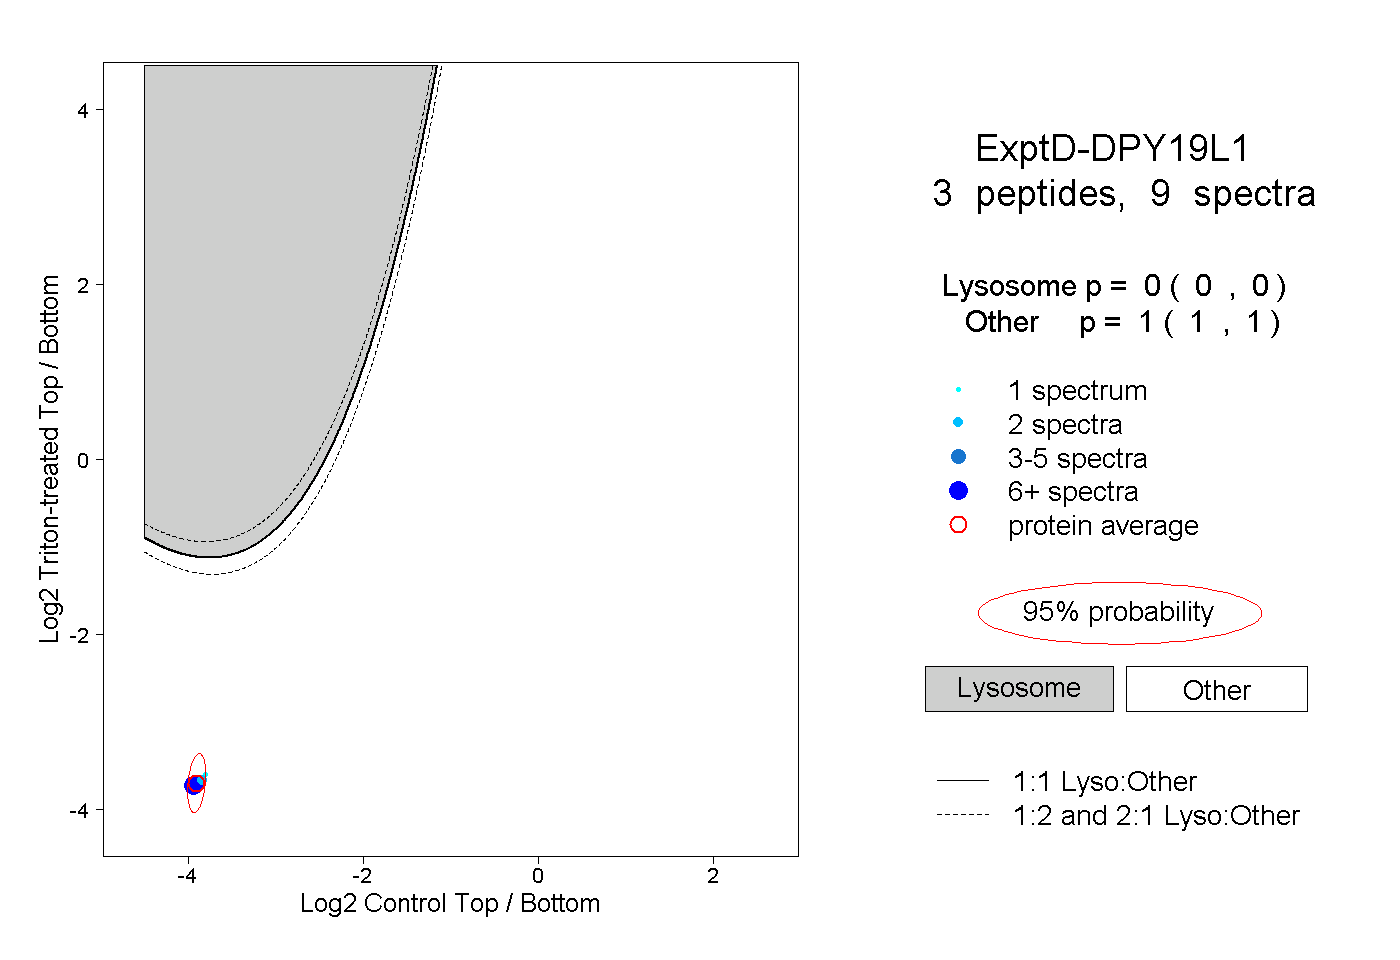
0.000 | 0.000
1.000 | 1.000