DPY19L1
[ENSRNOP00000033222]
Main page
| | | Plot |
Mito |
Lyso |
|
Perox |
ER |
Golgi |
PM |
Cytosol |
Nucleus |
|
| Expt A |
 8
8
peptides |
12
spectra |
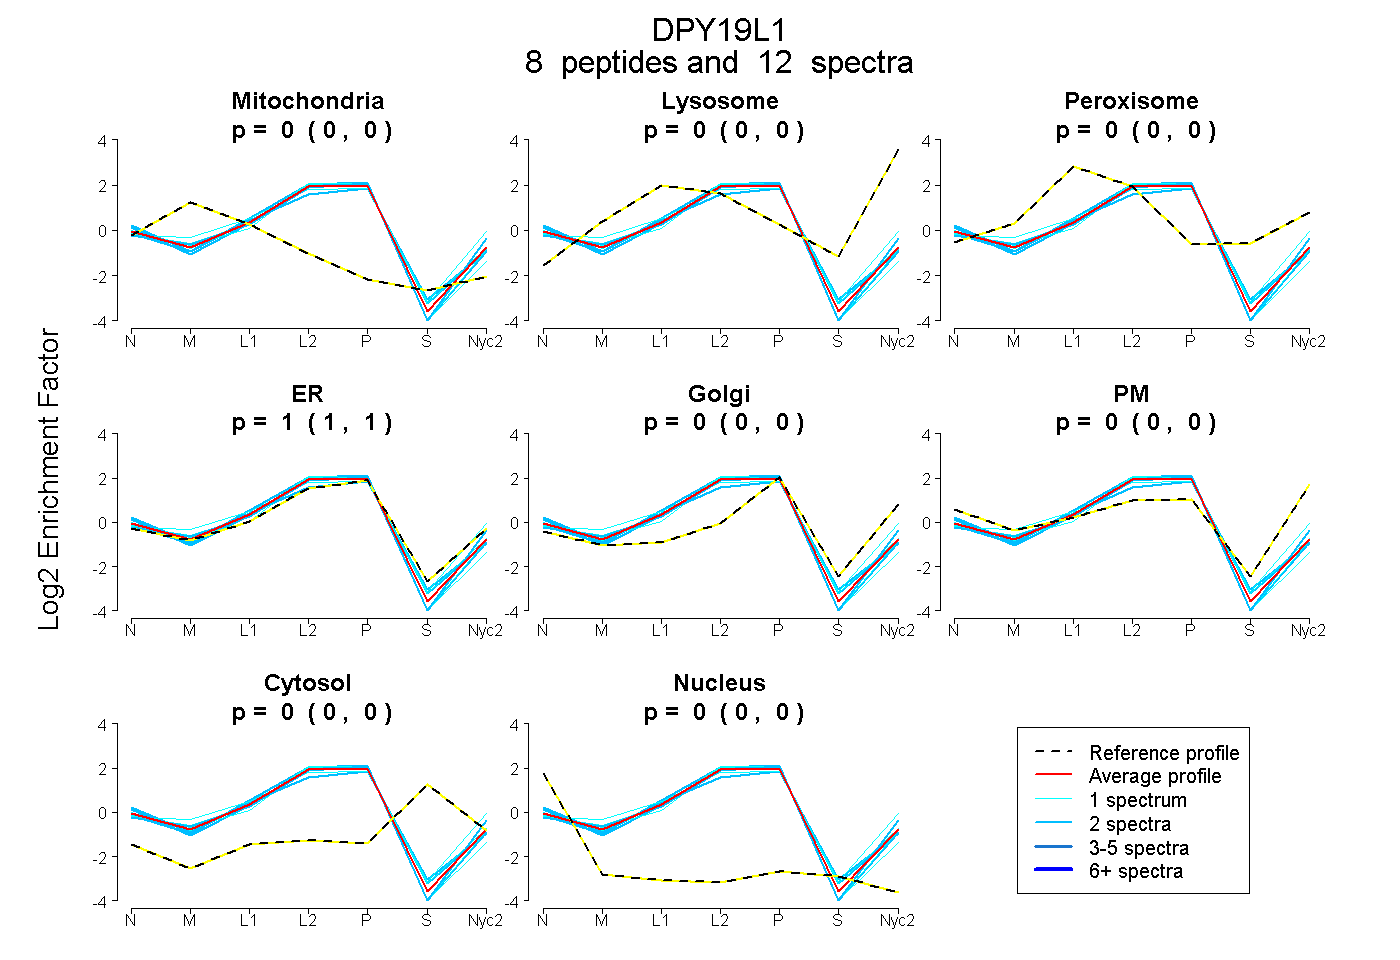 |
0.000
0.000 | 0.000 |
0.000
0.000 | 0.000 |
|
0.000
0.000 | 0.000 |
1.000
1.000 | 1.000 |
0.000
0.000 | 0.000 |
0.000
0.000 | 0.000 |
0.000
0.000 | 0.000 |
0.000
0.000 | 0.000 |
|
| | | Plot |
Mito |
|
Lyso or Perox |
|
ER |
Golgi |
PM |
Cytosol |
Nucleus |
|
| Expt B |
4
peptides |
4
spectra |
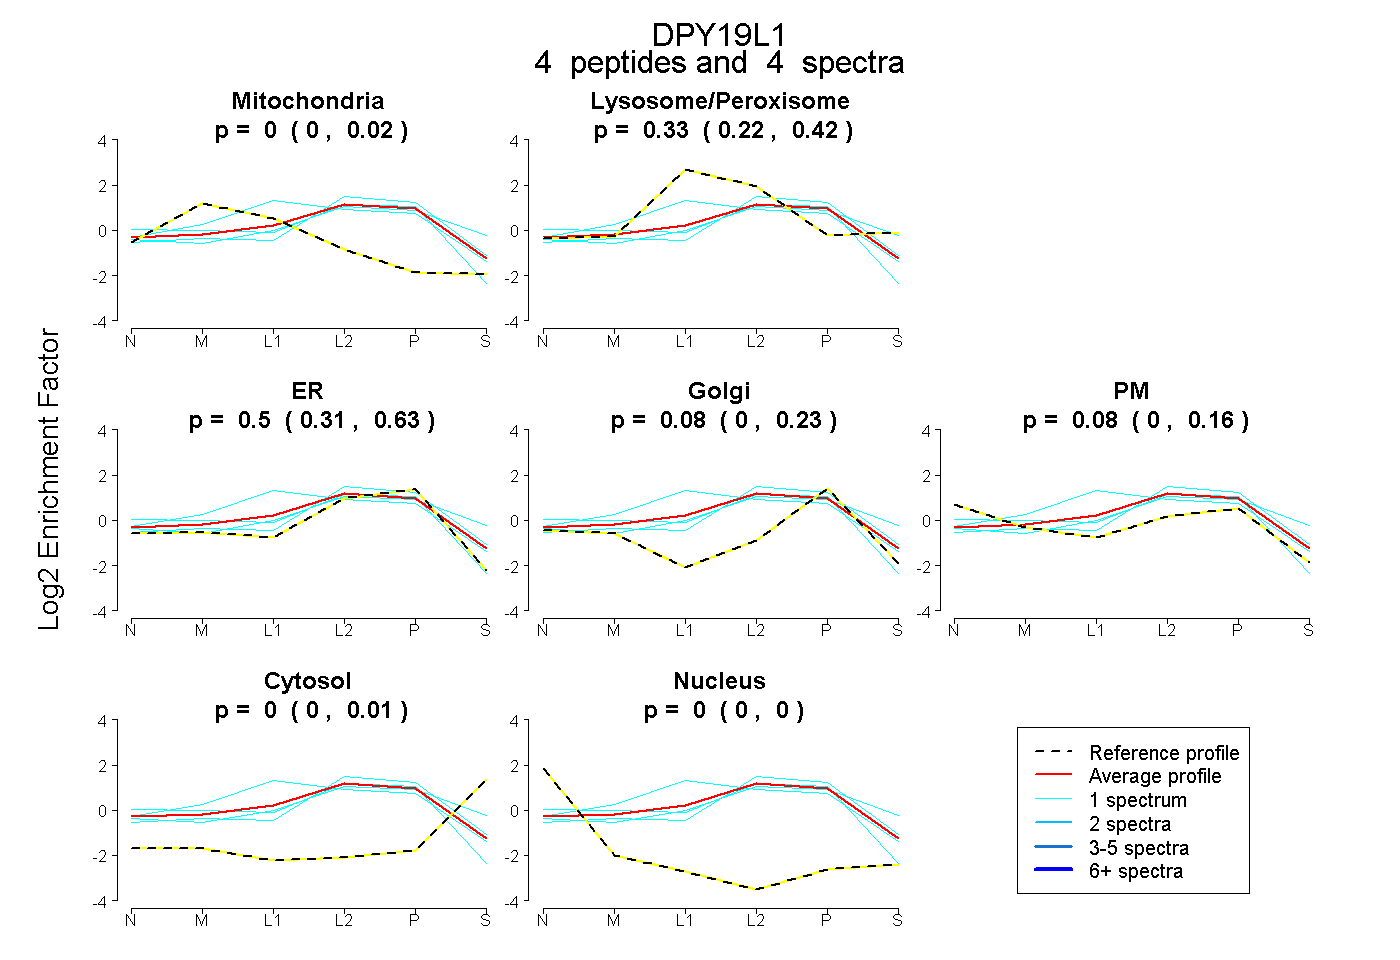 |
0.000
0.000 | 0.017 |
|
0.332
0.224 | 0.424 |
|
0.502
0.311 | 0.628 |
0.084
0.000 | 0.227 |
0.082
0.000 | 0.161 |
0.000
0.000 | 0.005 |
0.000
0.000 | 0.000 |
|
| 1 spectrum, ICWTVTR |
0.024 |
|
0.122 |
|
0.644 |
0.000 |
0.210 |
0.000 |
0.000 |
|
| 1 spectrum, LTEYPLVINTLK |
0.000 |
|
0.412 |
|
0.305 |
0.175 |
0.000 |
0.107 |
0.000 |
|
| 1 spectrum, IMDLIGIQTK |
0.000 |
|
0.206 |
|
0.757 |
0.000 |
0.000 |
0.037 |
0.000 |
|
| 1 spectrum, APPSPGR |
0.123 |
|
0.455 |
|
0.403 |
0.000 |
0.020 |
0.000 |
0.000 |
|
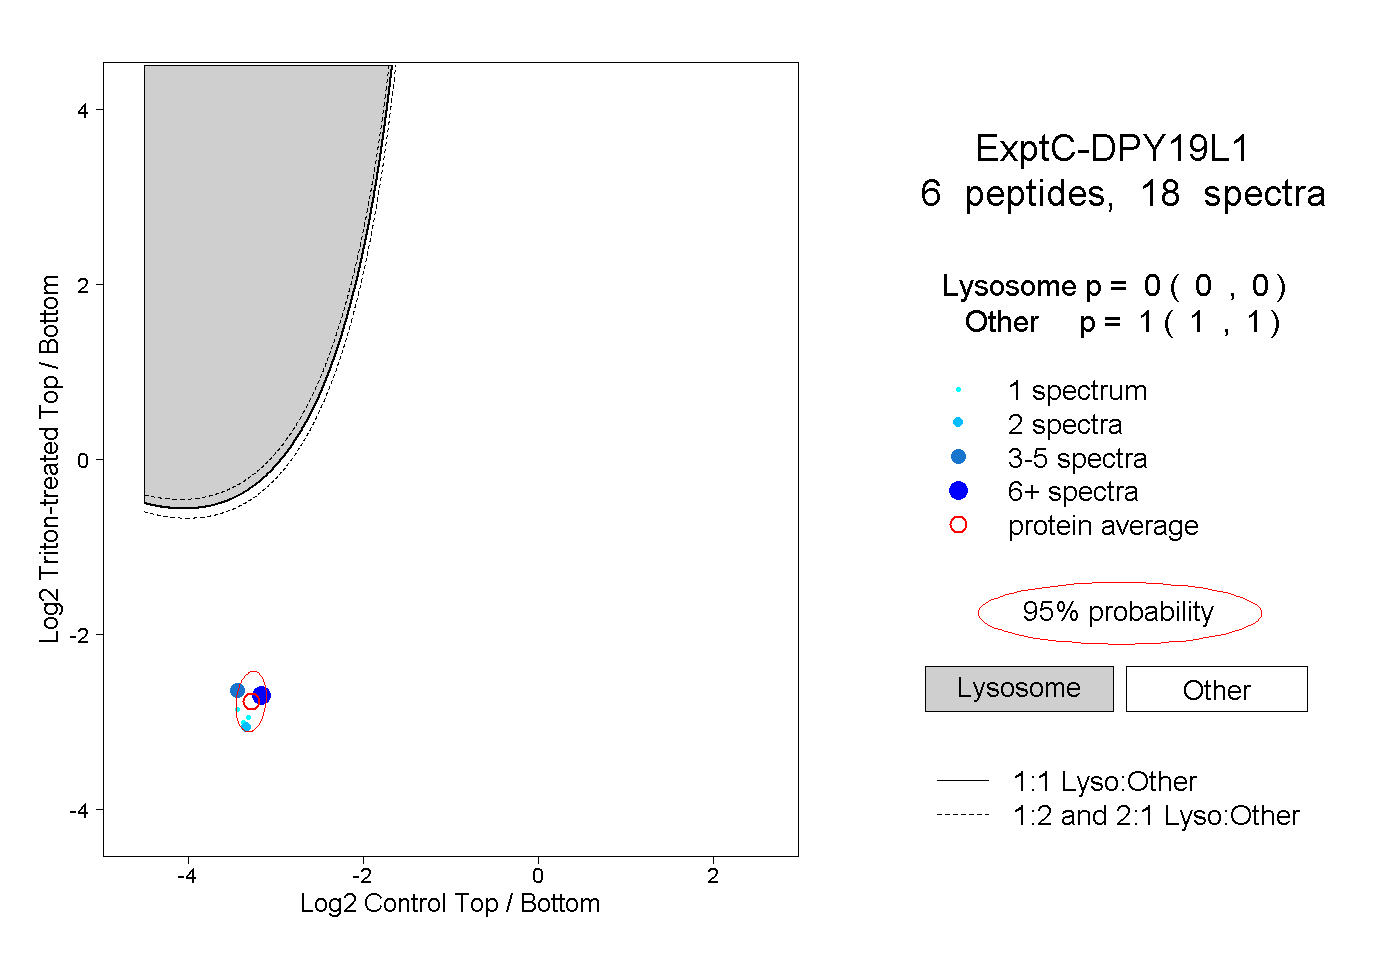
| | | Plot |
|
Lyso |
|
|
|
|
|
|
|
Other |
| Expt C |
6
peptides |
18
spectra |
 |
|
0.000
0.000 | 0.000 |
|
|
|
|
|
|
|
1.000
1.000 | 1.000 |
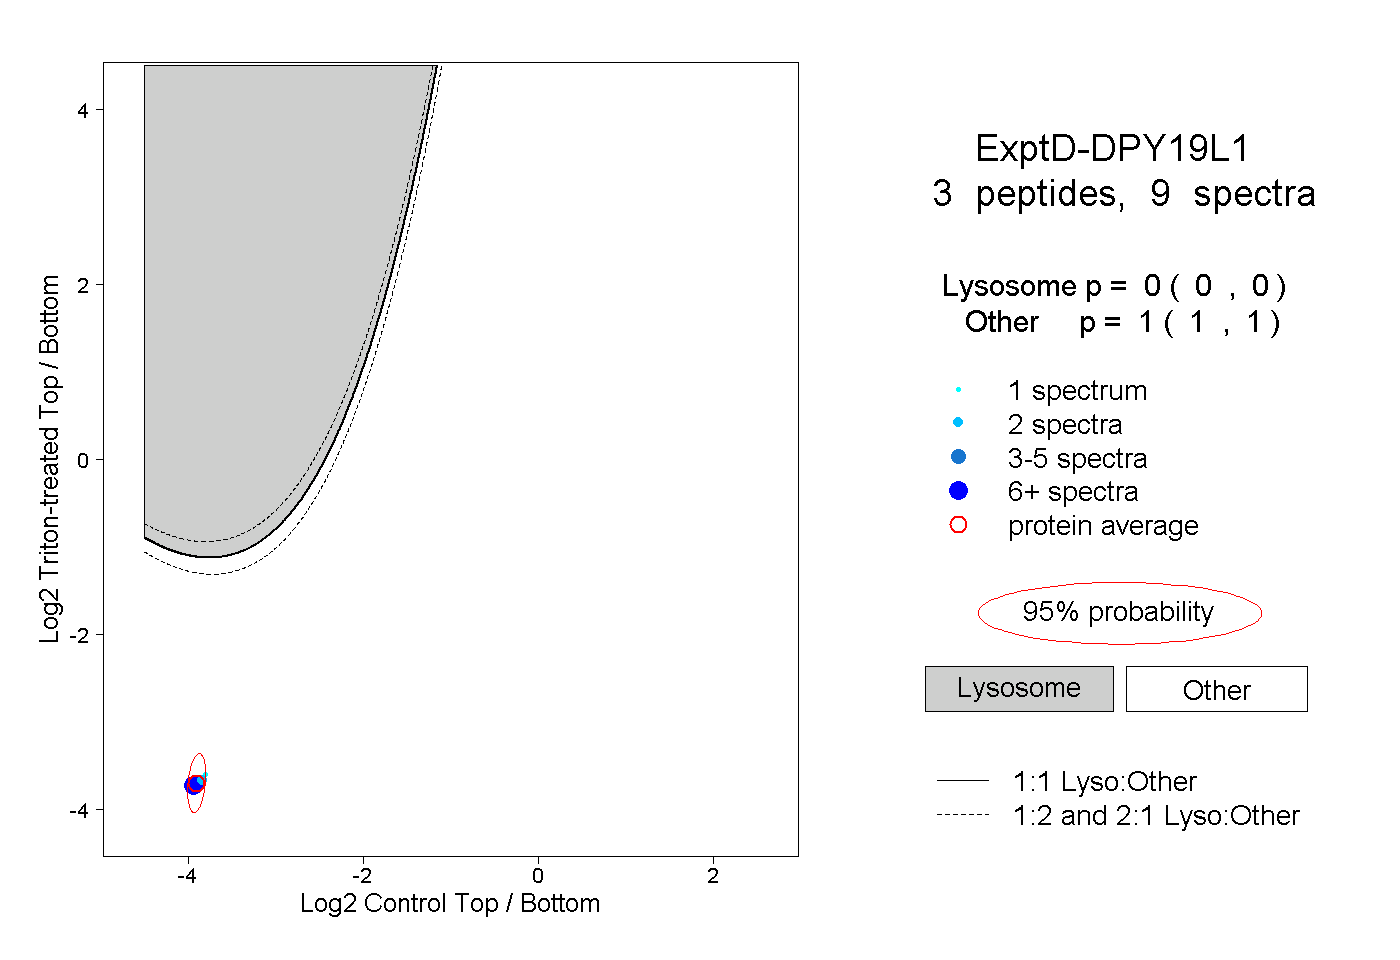
| | | Plot |
|
Lyso |
|
|
|
|
|
|
|
Other |
| Expt D |
3
peptides |
9
spectra |
 |
|
0.000
0.000 | 0.000 |
|
|
|
|
|
|
|
1.000
1.000 | 1.000 |