 11
11peptides
spectra
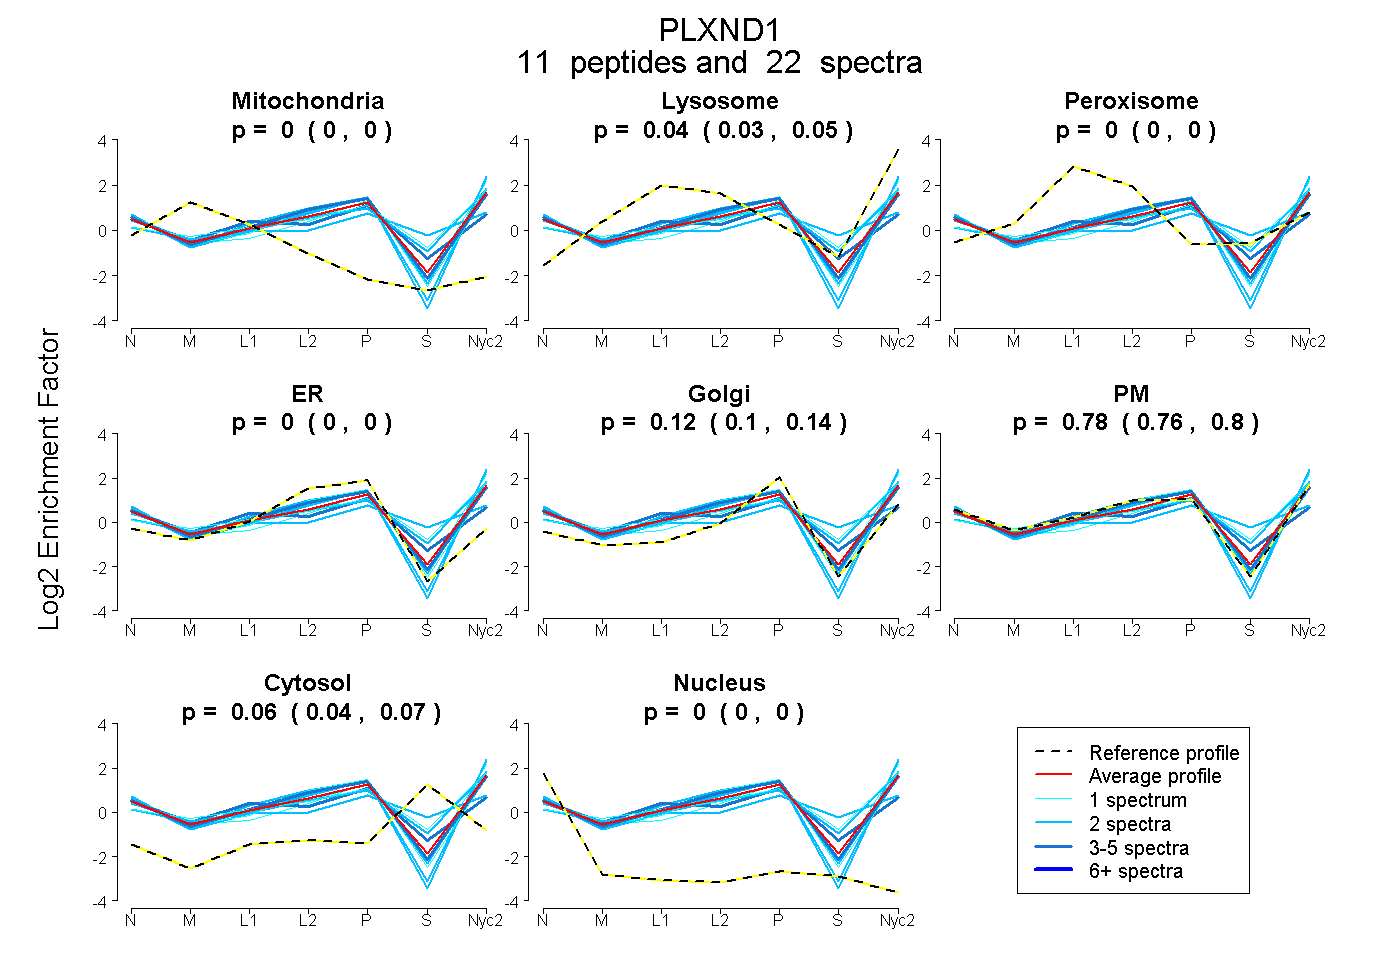
0.000 | 0.000
0.025 | 0.051
0.000 | 0.000
0.000 | 0.000
0.100 | 0.137
0.763 | 0.801
0.043 | 0.070
0.000 | 0.000
1peptide
spectra
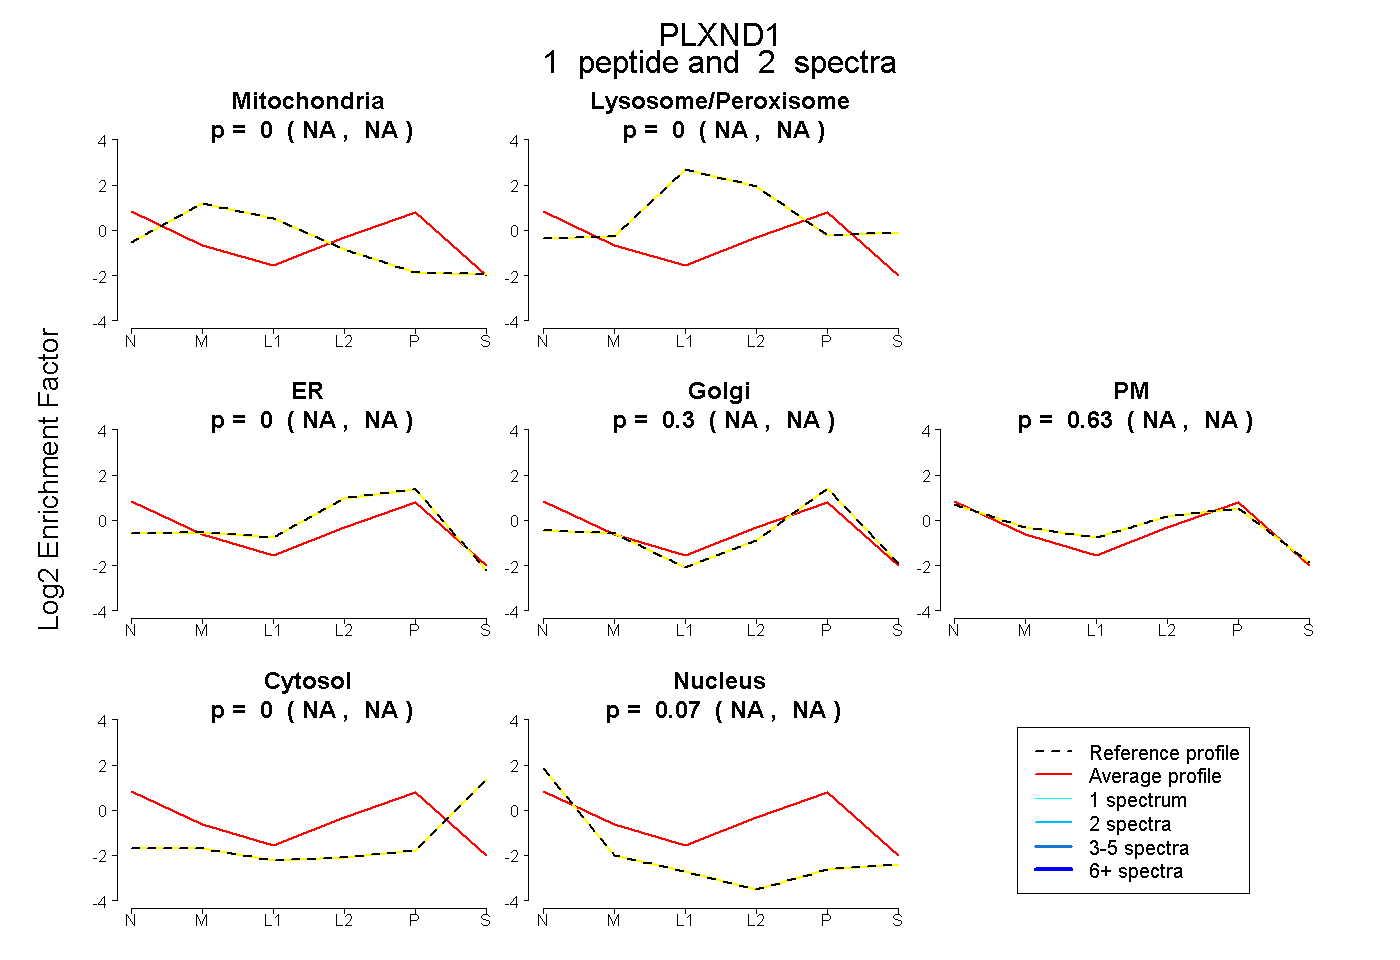
NA | NA
NA | NA
NA | NA
NA | NA
NA | NA
NA | NA
NA | NA
12peptides
spectra
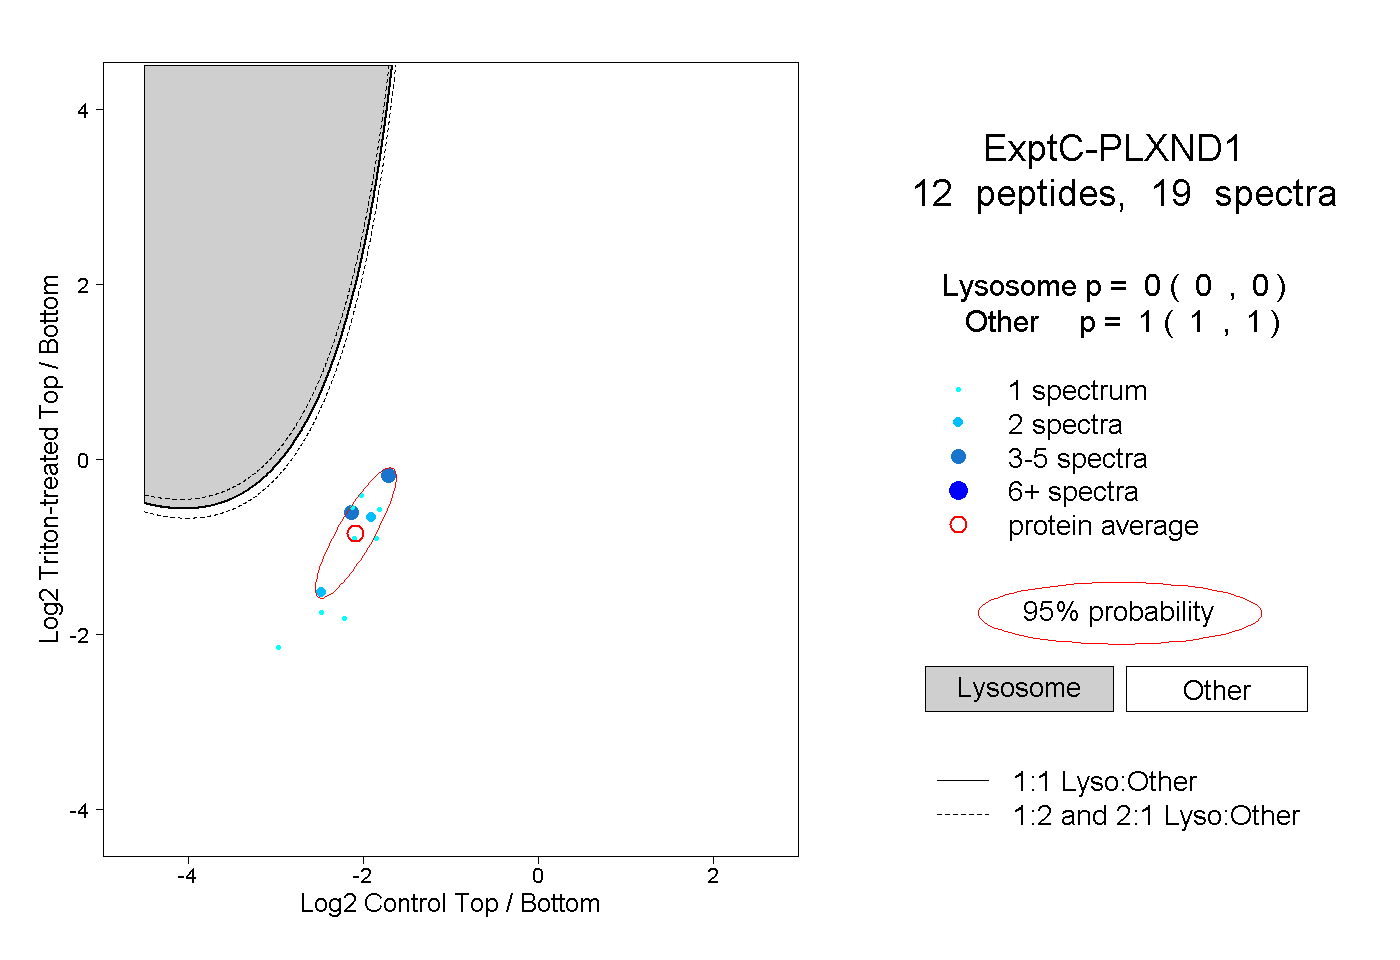
0.000 | 0.000
1.000 | 1.000