 11
11peptides
spectra
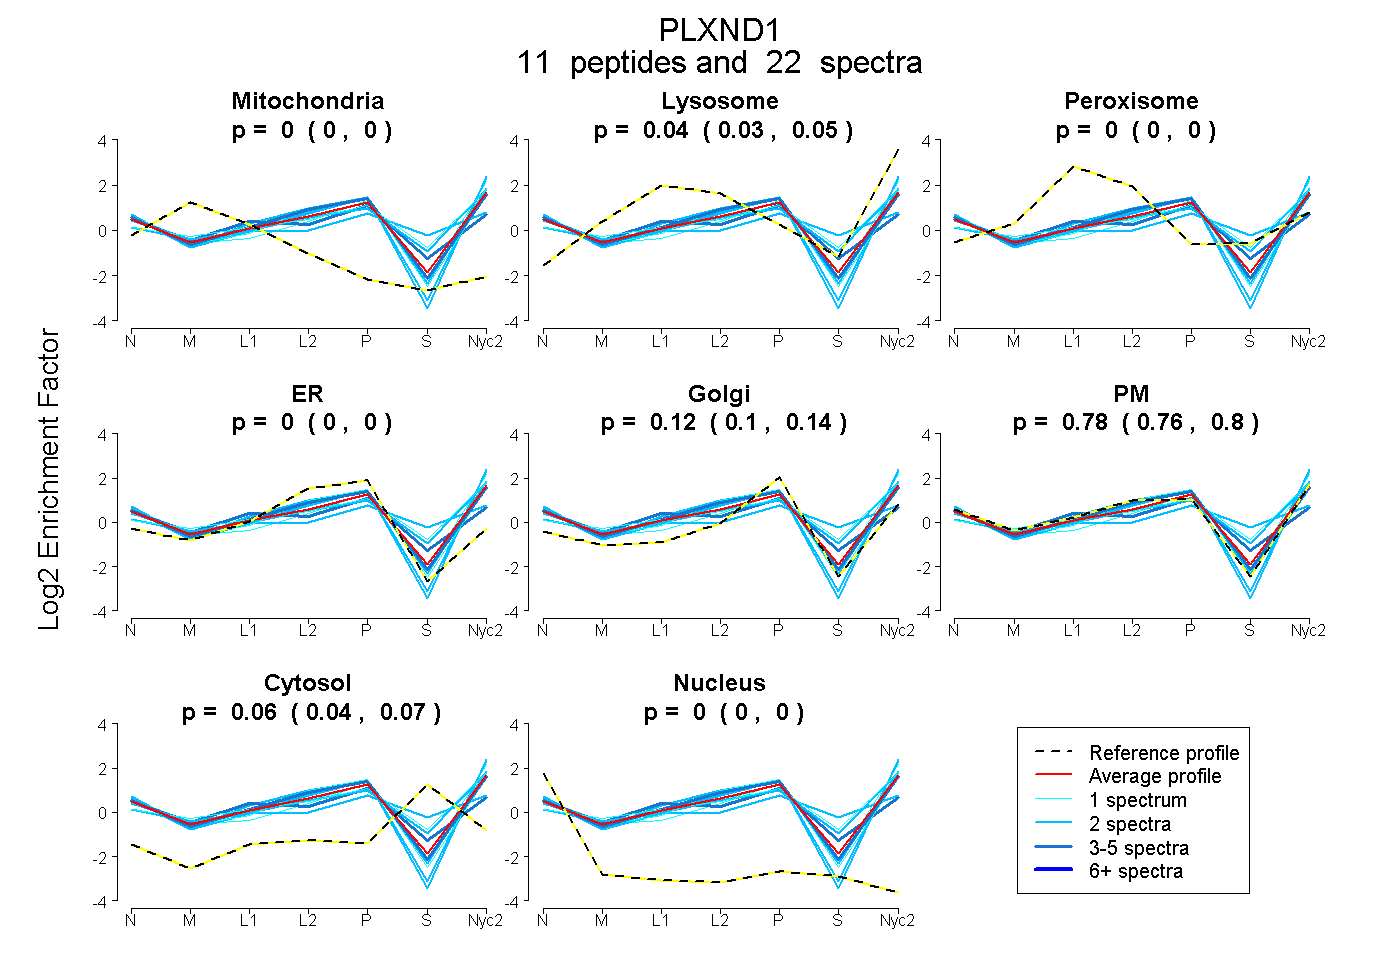
0.000 | 0.000
0.025 | 0.051
0.000 | 0.000
0.000 | 0.000
0.100 | 0.137
0.763 | 0.801
0.043 | 0.070
0.000 | 0.000
| Plot | Mito | Lyso | Perox | ER | Golgi | PM | Cytosol | Nucleus | |||||
| Expt A |
11 peptides |
22 spectra |
|
0.000 0.000 | 0.000 |
0.038 0.025 | 0.051 |
0.000 0.000 | 0.000 |
0.000 0.000 | 0.000 |
0.120 0.100 | 0.137 |
0.784 0.763 | 0.801 |
0.057 0.043 | 0.070 |
0.000 0.000 | 0.000 |
| 4 spectra, GDLYSR | 0.000 | 0.000 | 0.226 | 0.000 | 0.308 | 0.357 | 0.077 | 0.032 | ||
| 2 spectra, FLDDLFK | 0.000 | 0.000 | 0.000 | 0.000 | 0.052 | 0.948 | 0.000 | 0.000 | ||
| 2 spectra, GISDPDTLHIWK | 0.000 | 0.126 | 0.000 | 0.000 | 0.000 | 0.703 | 0.171 | 0.000 | ||
| 1 spectrum, ENIEAKPR | 0.000 | 0.000 | 0.000 | 0.000 | 0.224 | 0.706 | 0.070 | 0.000 | ||
| 1 spectrum, NAPAALCAFR | 0.000 | 0.000 | 0.000 | 0.033 | 0.177 | 0.790 | 0.000 | 0.000 | ||
| 2 spectra, LVSVFPAR | 0.000 | 0.000 | 0.000 | 0.000 | 0.179 | 0.821 | 0.000 | 0.000 | ||
| 2 spectra, HHPGEPLTLVIHK | 0.000 | 0.006 | 0.154 | 0.000 | 0.138 | 0.402 | 0.300 | 0.000 | ||
| 1 spectrum, YRPQIMAALEANPTAR | 0.000 | 0.229 | 0.000 | 0.000 | 0.096 | 0.511 | 0.165 | 0.000 | ||
| 4 spectra, TATSITCTVPR | 0.000 | 0.002 | 0.007 | 0.012 | 0.123 | 0.842 | 0.013 | 0.000 | ||
| 2 spectra, DLDDTSVVEDGR | 0.000 | 0.000 | 0.000 | 0.000 | 0.000 | 1.000 | 0.000 | 0.000 | ||
| 1 spectrum, ELLVDLIDASAAK | 0.000 | 0.083 | 0.000 | 0.000 | 0.081 | 0.836 | 0.000 | 0.000 |
| Plot | Mito | Lyso or Perox | ER | Golgi | PM | Cytosol | Nucleus | ||||||
| Expt B |
1 peptide |
2 spectra |
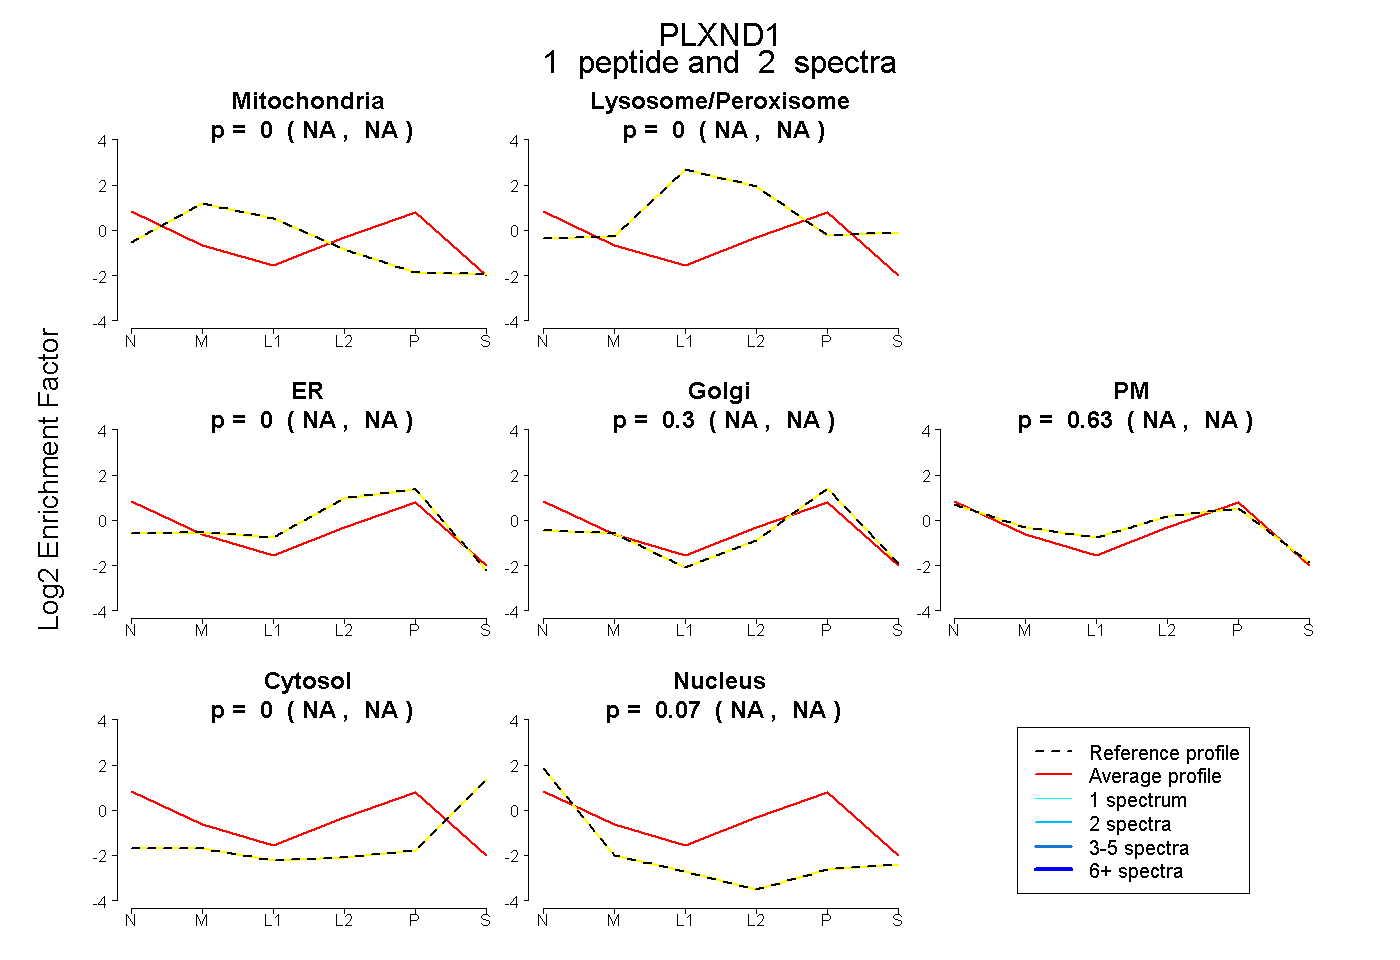 |
0.000 NA | NA |
0.000 NA | NA |
0.000 NA | NA |
0.300 NA | NA |
0.627 NA | NA |
0.000 NA | NA |
0.073 NA | NA |
|||
| Plot | Lyso | Other | |||||||||||
| Expt C |
12 peptides |
19 spectra |
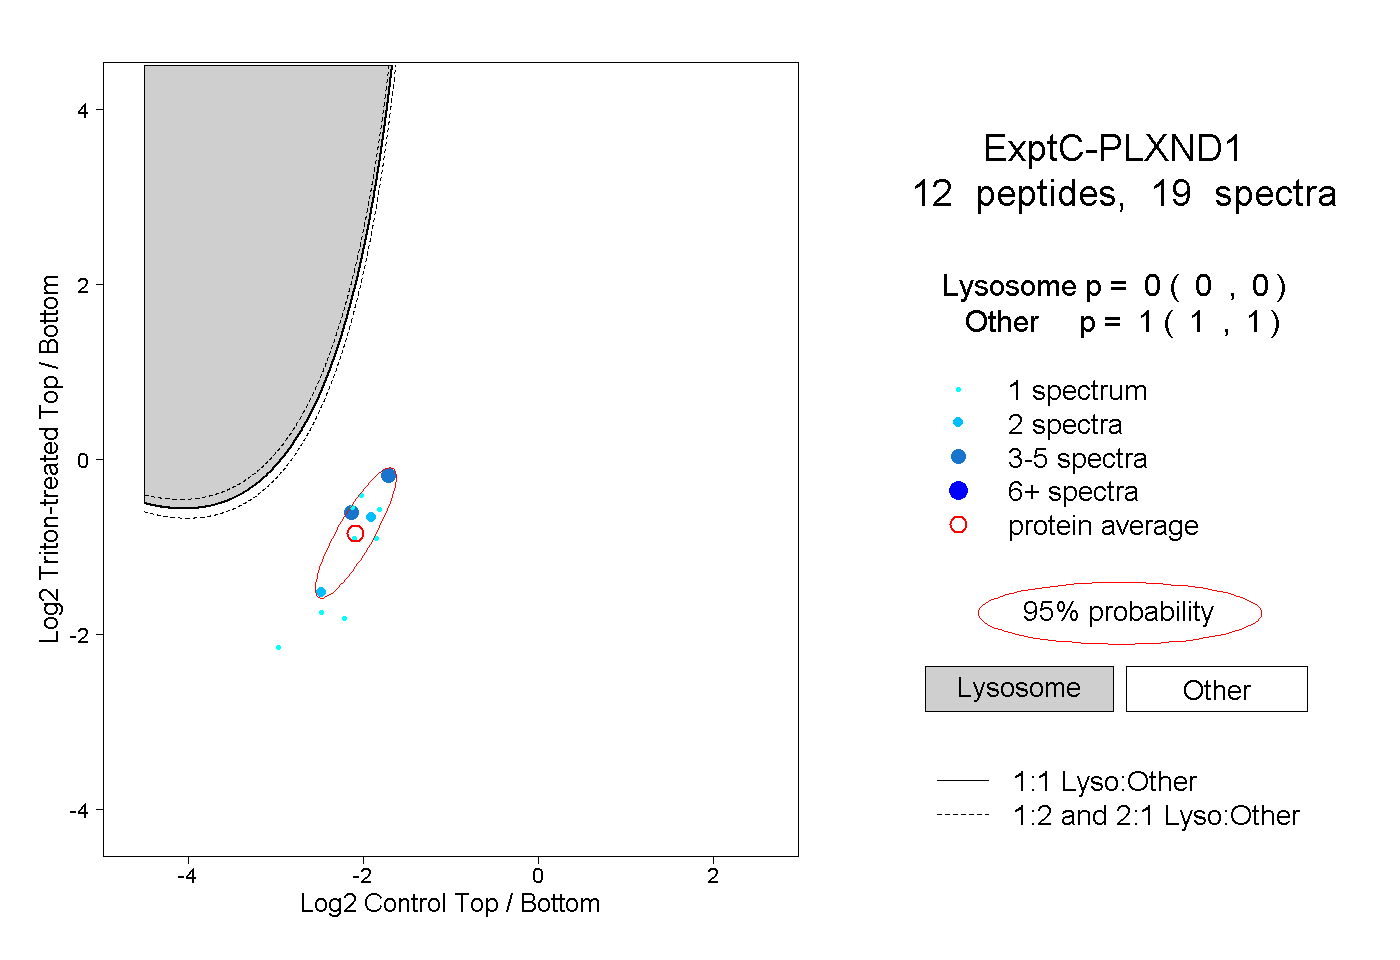 |
0.000 0.000 | 0.000 |
1.000 1.000 | 1.000 |