 7
7peptides
spectra
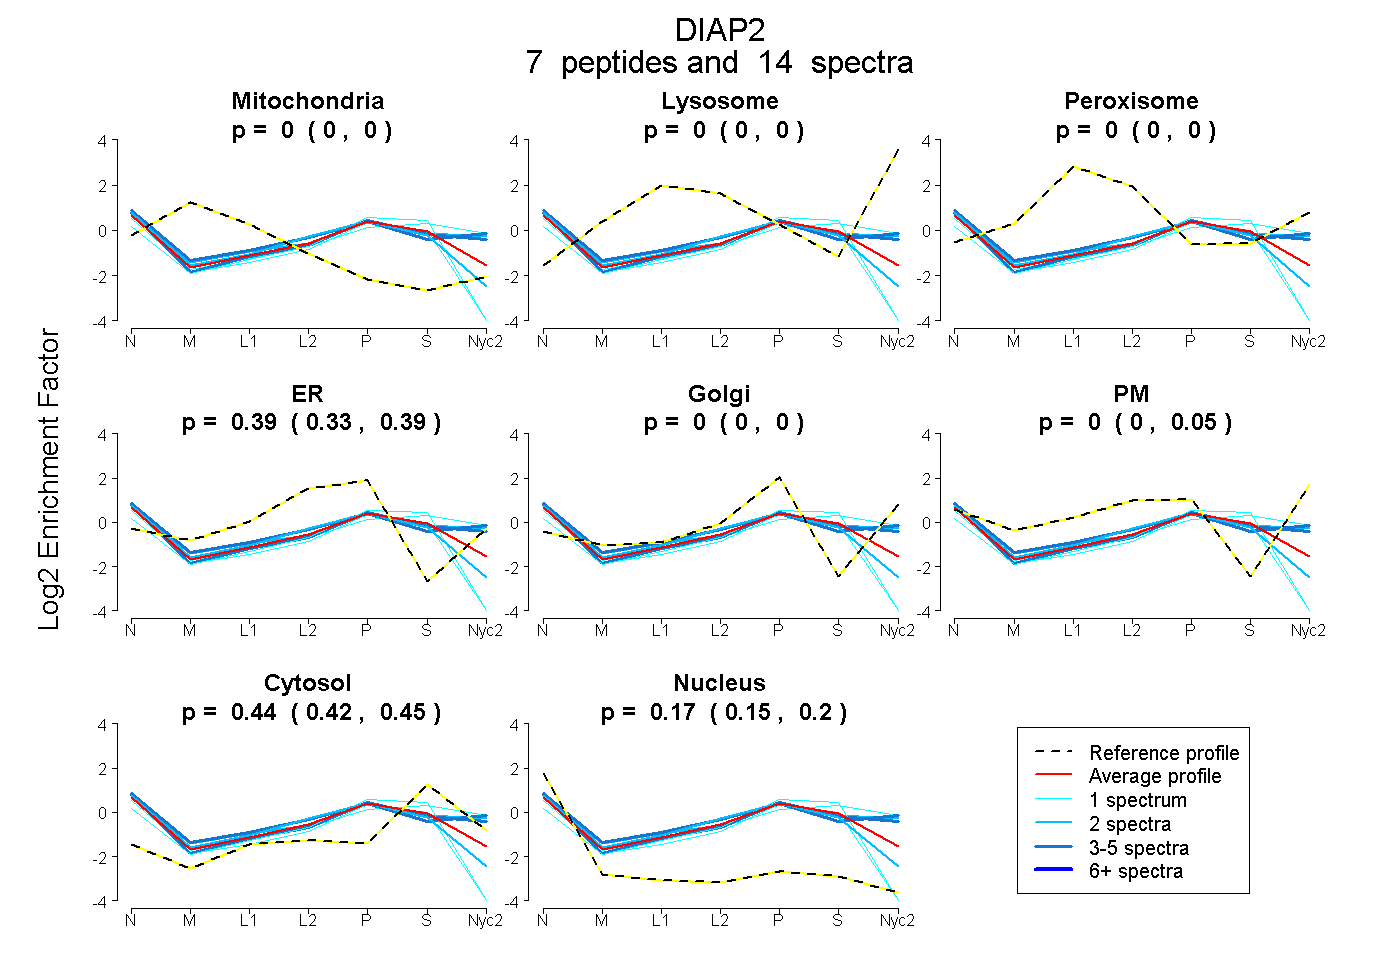
0.000 | 0.000
0.000 | 0.000
0.000 | 0.000
0.328 | 0.395
0.000 | 0.000
0.000 | 0.053
0.417 | 0.448
0.153 | 0.195
3peptides
spectra
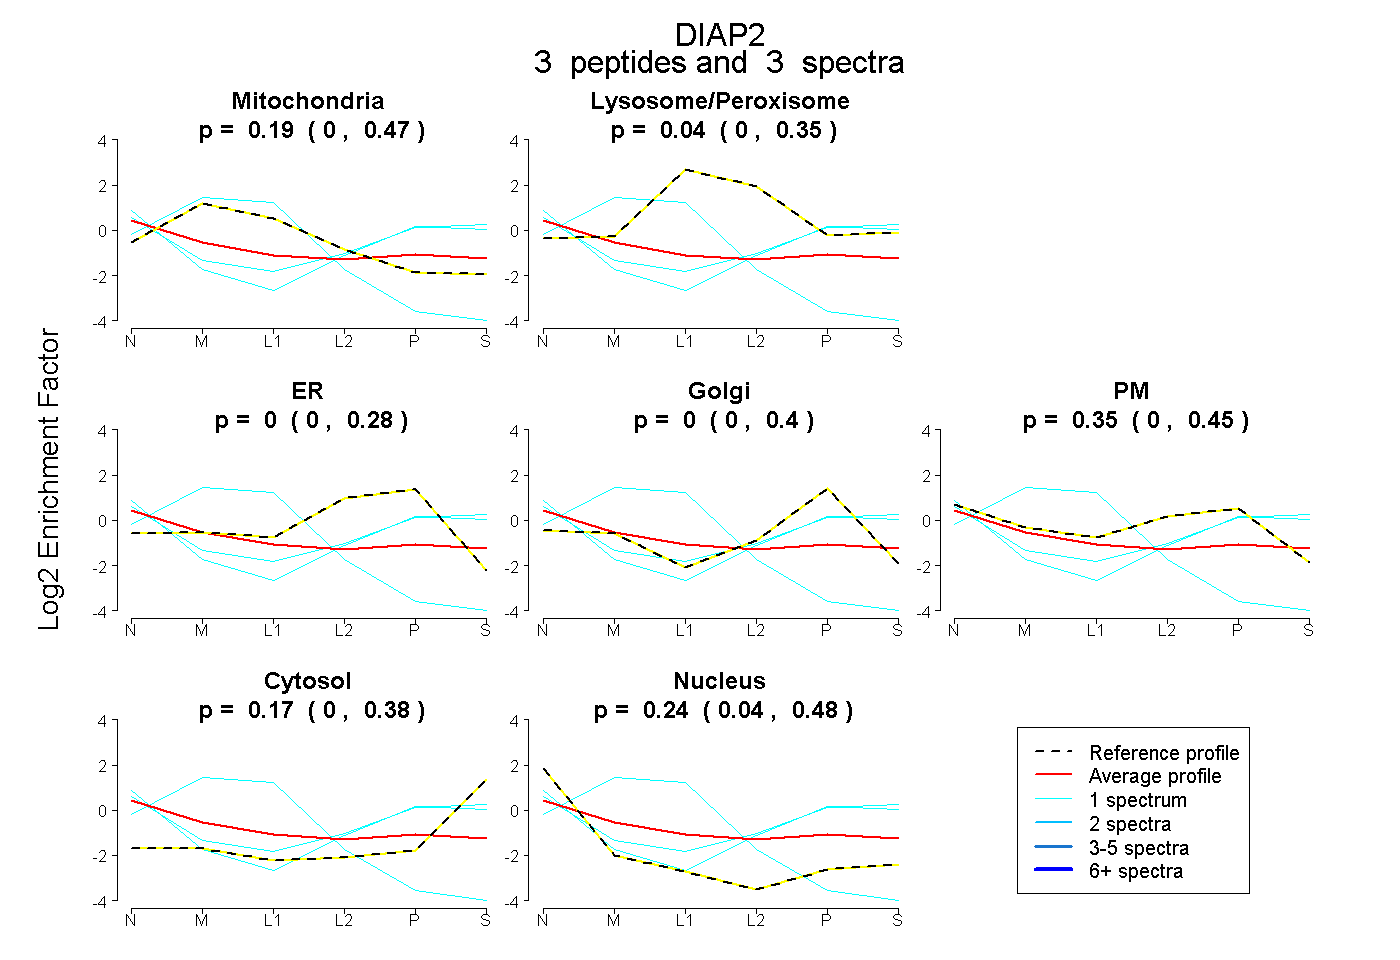
0.000 | 0.474
0.000 | 0.346
0.000 | 0.280
0.000 | 0.398
0.000 | 0.448
0.000 | 0.379
0.039 | 0.475
9peptides
spectra
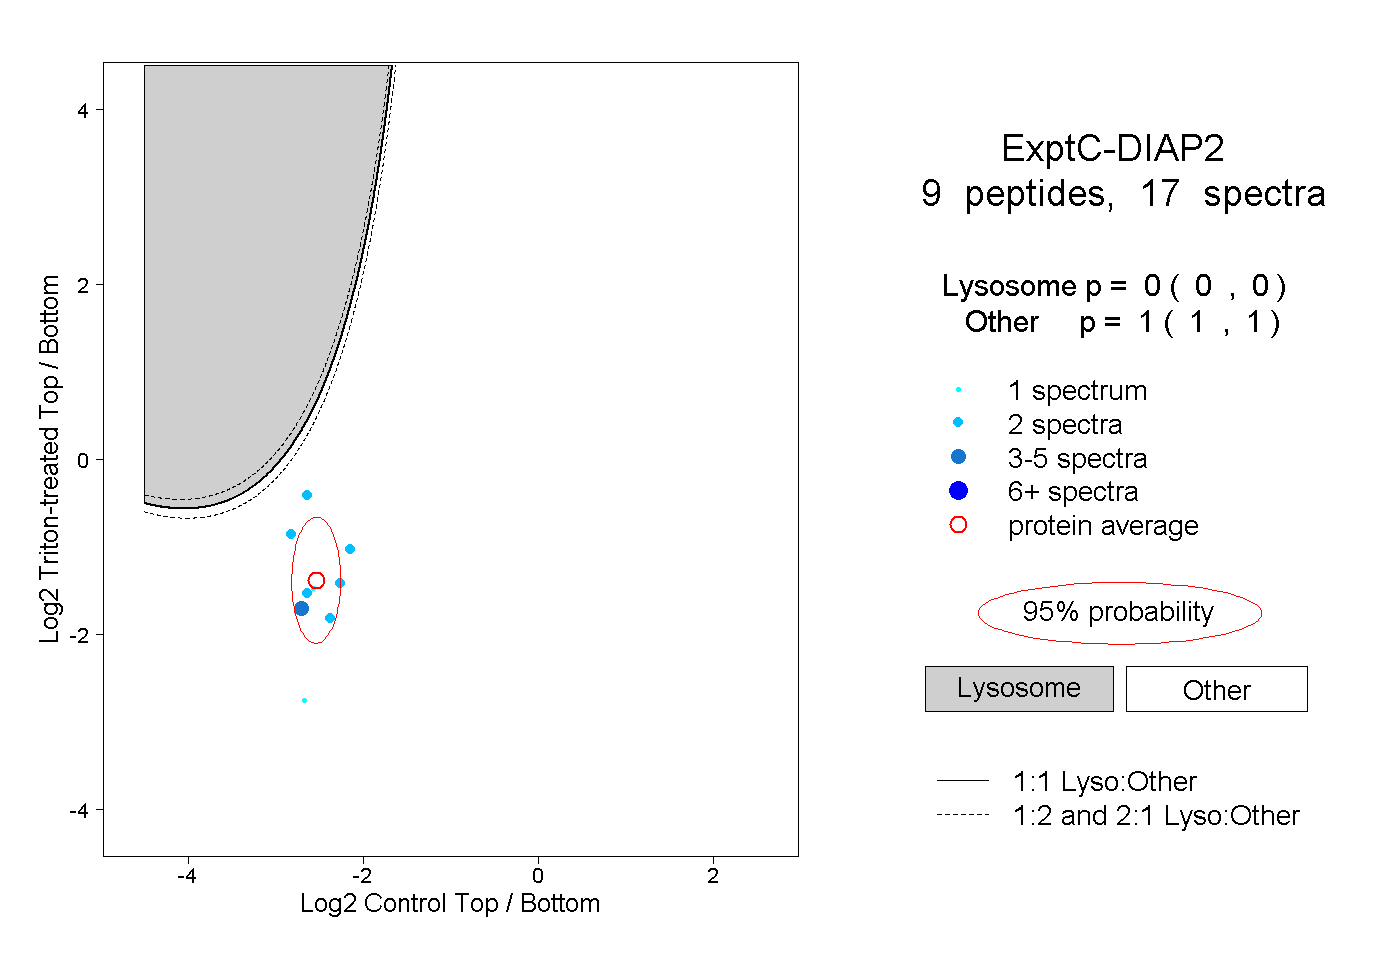
0.000 | 0.000
1.000 | 1.000