 7
7peptides
spectra
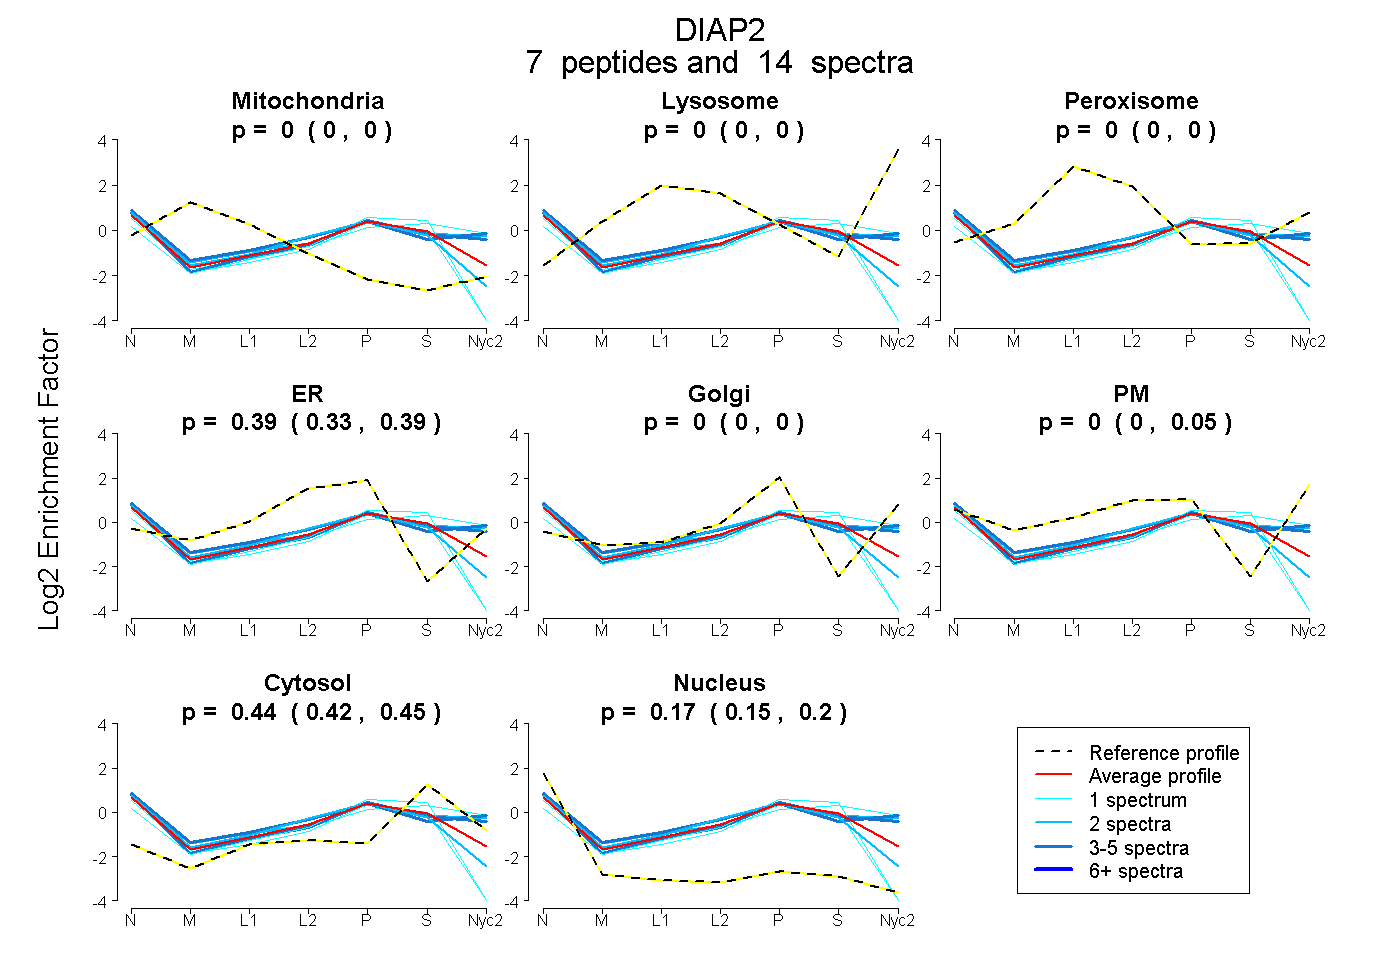
0.000 | 0.000
0.000 | 0.000
0.000 | 0.000
0.328 | 0.395
0.000 | 0.000
0.000 | 0.053
0.417 | 0.448
0.153 | 0.195
| Plot | Mito | Lyso | Perox | ER | Golgi | PM | Cytosol | Nucleus | |||||
| Expt A |
7 peptides |
14 spectra |
|
0.000 0.000 | 0.000 |
0.000 0.000 | 0.000 |
0.000 0.000 | 0.000 |
0.390 0.328 | 0.395 |
0.000 0.000 | 0.000 |
0.000 0.000 | 0.053 |
0.435 0.417 | 0.448 |
0.175 0.153 | 0.195 |
| 1 spectrum, INFLCK | 0.000 | 0.000 | 0.000 | 0.284 | 0.000 | 0.000 | 0.338 | 0.377 | ||
| 4 spectra, QEAQAEIQK | 0.000 | 0.000 | 0.000 | 0.000 | 0.180 | 0.274 | 0.417 | 0.129 | ||
| 1 spectrum, TAQNLSIFLGSYR | 0.000 | 0.000 | 0.000 | 0.269 | 0.000 | 0.000 | 0.455 | 0.275 | ||
| 2 spectra, TLFLEALK | 0.000 | 0.000 | 0.000 | 0.414 | 0.000 | 0.000 | 0.348 | 0.238 | ||
| 3 spectra, LLGGITAAAER | 0.000 | 0.000 | 0.000 | 0.039 | 0.015 | 0.469 | 0.363 | 0.114 | ||
| 1 spectrum, FDEEFTAR | 0.000 | 0.000 | 0.000 | 0.000 | 0.051 | 0.334 | 0.543 | 0.072 | ||
| 2 spectra, ENDELDIQLR | 0.000 | 0.000 | 0.000 | 0.001 | 0.070 | 0.399 | 0.428 | 0.101 |
| Plot | Mito | Lyso or Perox | ER | Golgi | PM | Cytosol | Nucleus | ||||||
| Expt B |
3 peptides |
3 spectra |
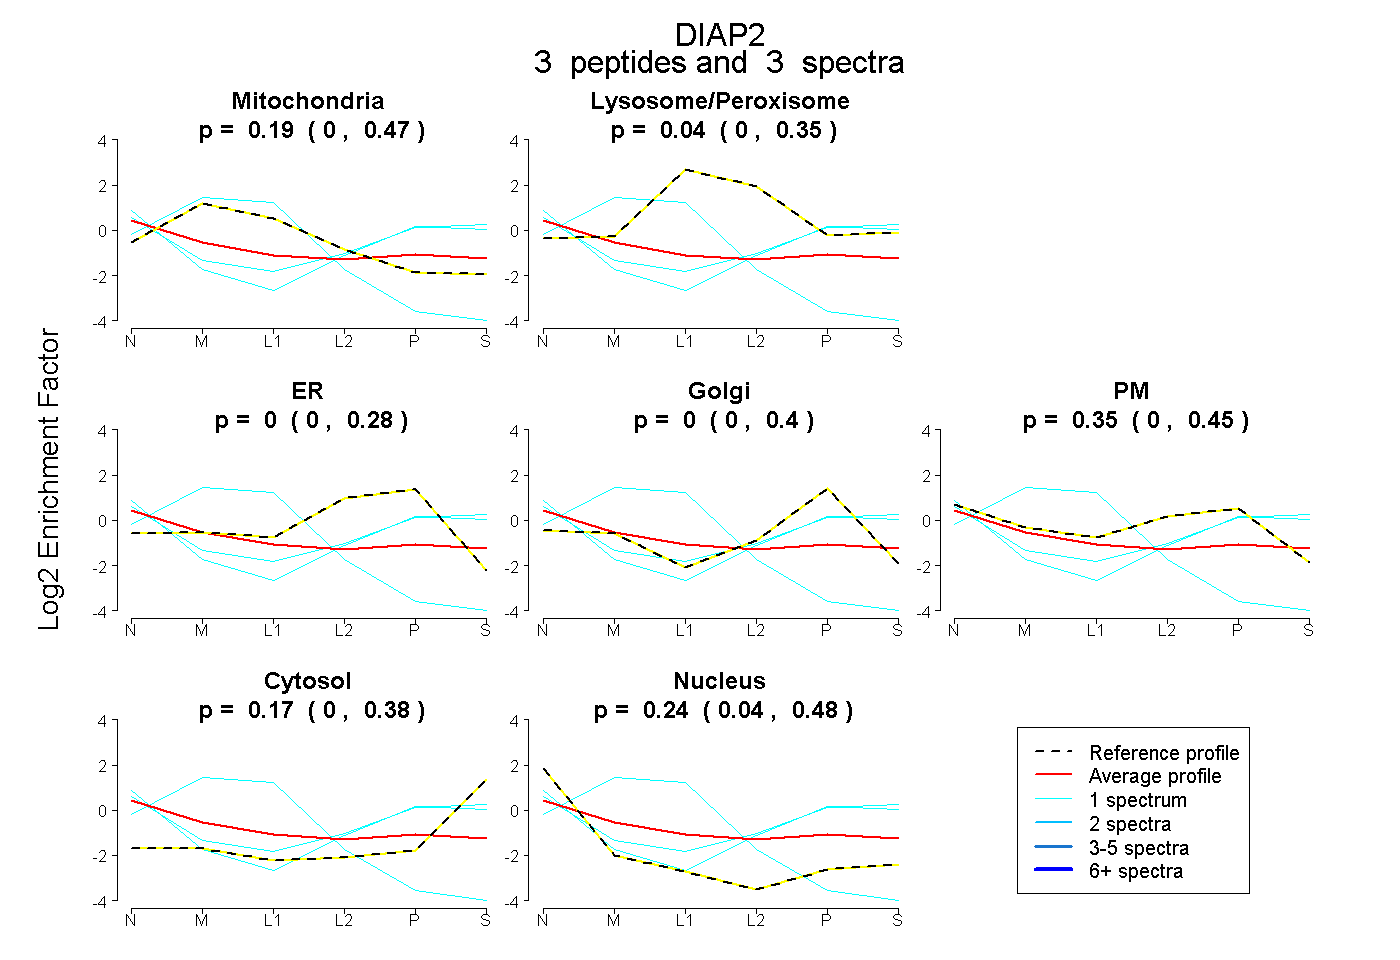 |
0.194 0.000 | 0.474 |
0.039 0.000 | 0.346 |
0.000 0.000 | 0.280 |
0.000 0.000 | 0.398 |
0.354 0.000 | 0.448 |
0.174 0.000 | 0.379 |
0.239 0.039 | 0.475 |
|||
| Plot | Lyso | Other | |||||||||||
| Expt C |
9 peptides |
17 spectra |
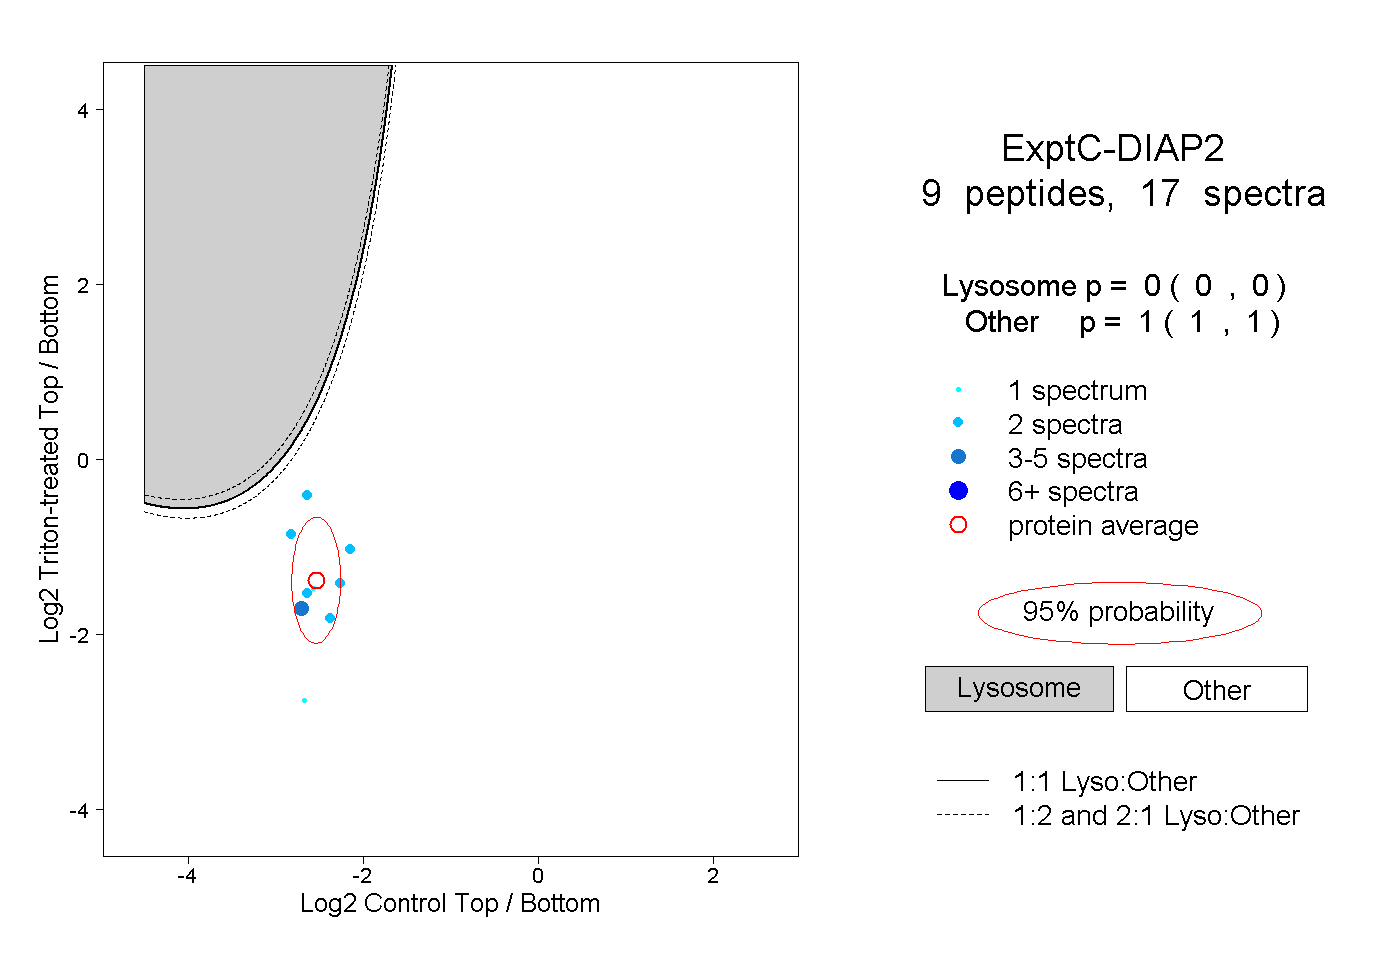 |
0.000 0.000 | 0.000 |
1.000 1.000 | 1.000 |