 3
3peptides
spectra
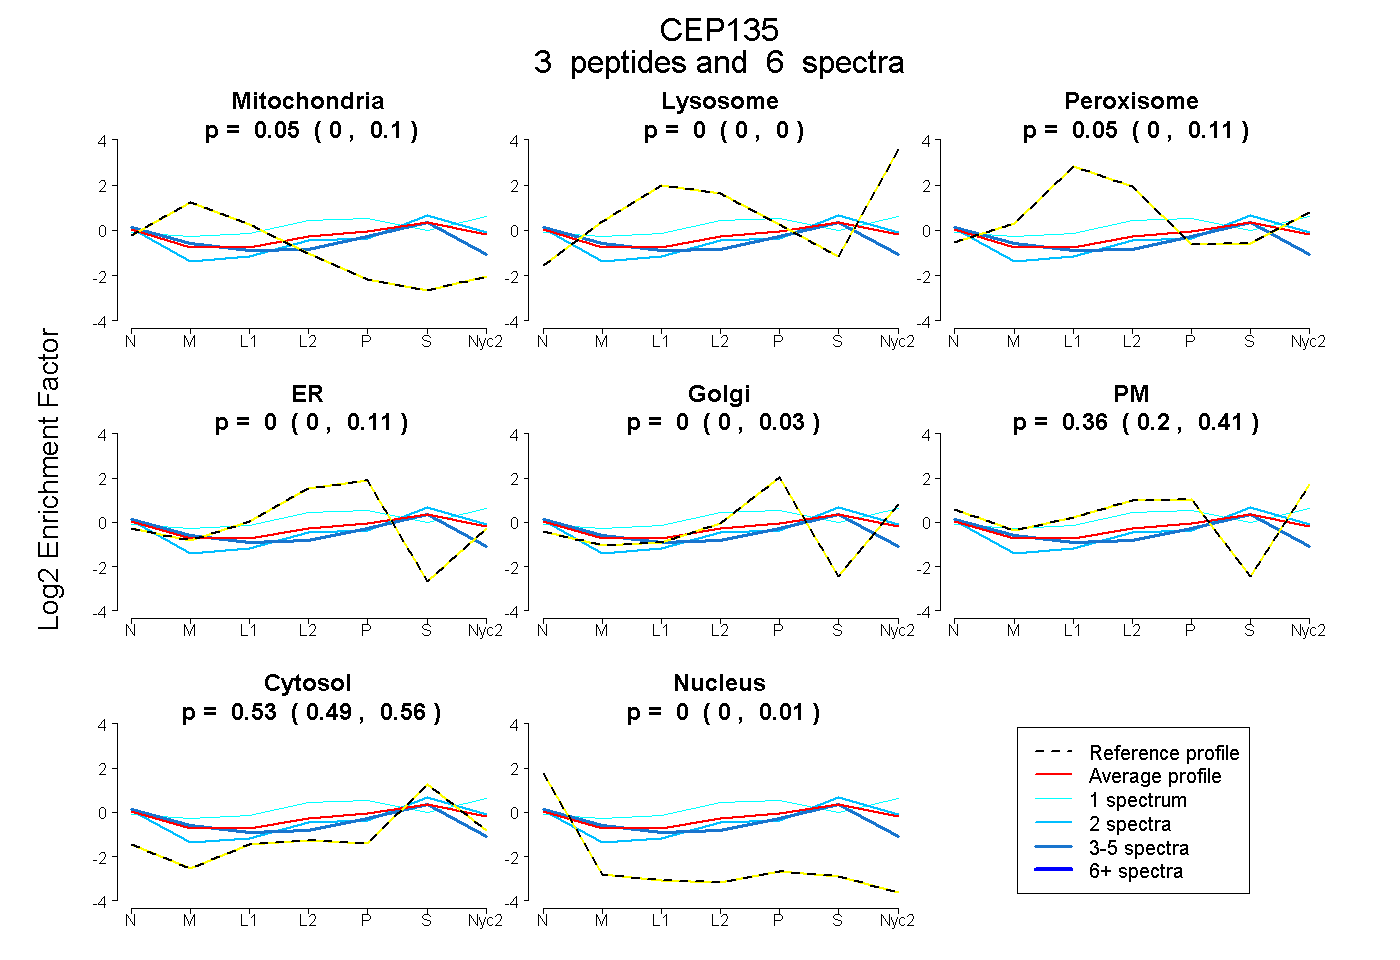
0.000 | 0.100
0.000 | 0.000
0.000 | 0.113
0.000 | 0.113
0.000 | 0.029
0.197 | 0.407
0.489 | 0.561
0.000 | 0.006
1peptide
spectra
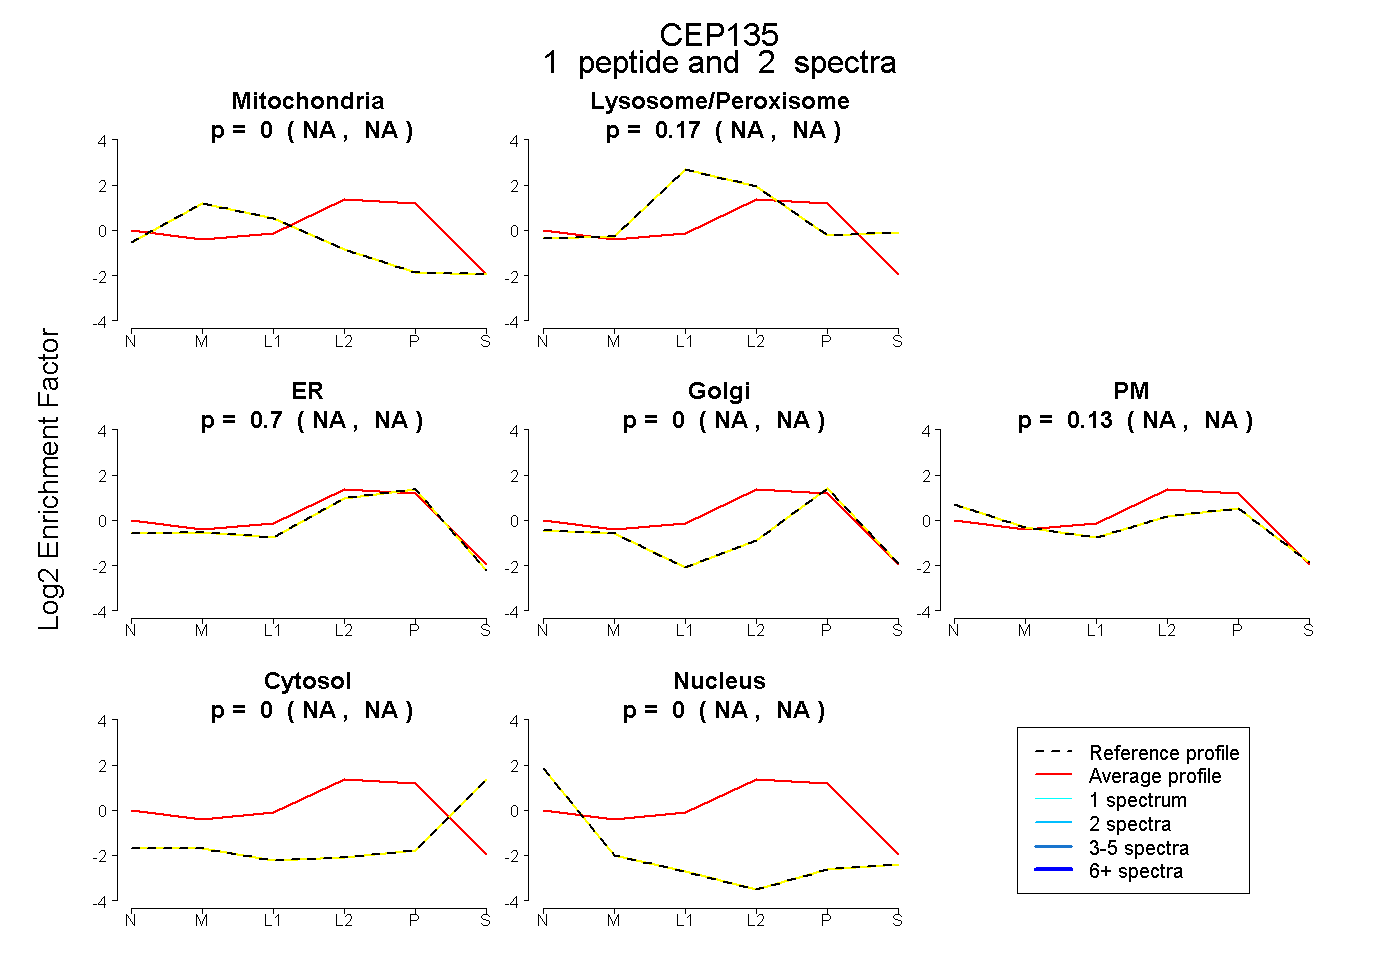
NA | NA
NA | NA
NA | NA
NA | NA
NA | NA
NA | NA
NA | NA
1peptide
spectra
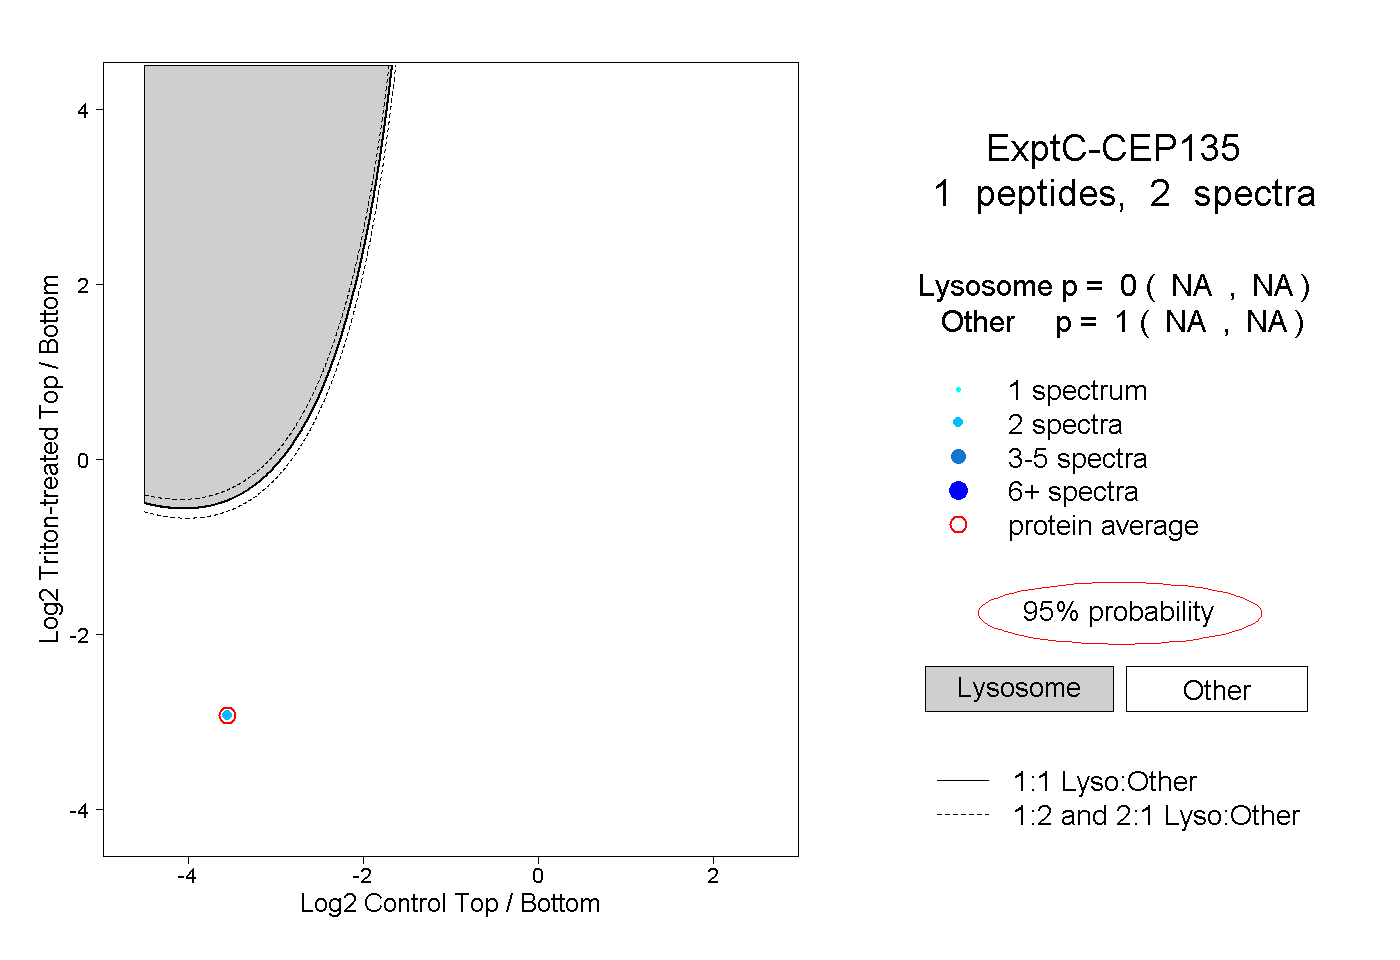
NA | NA
NA | NA
1peptide
spectra
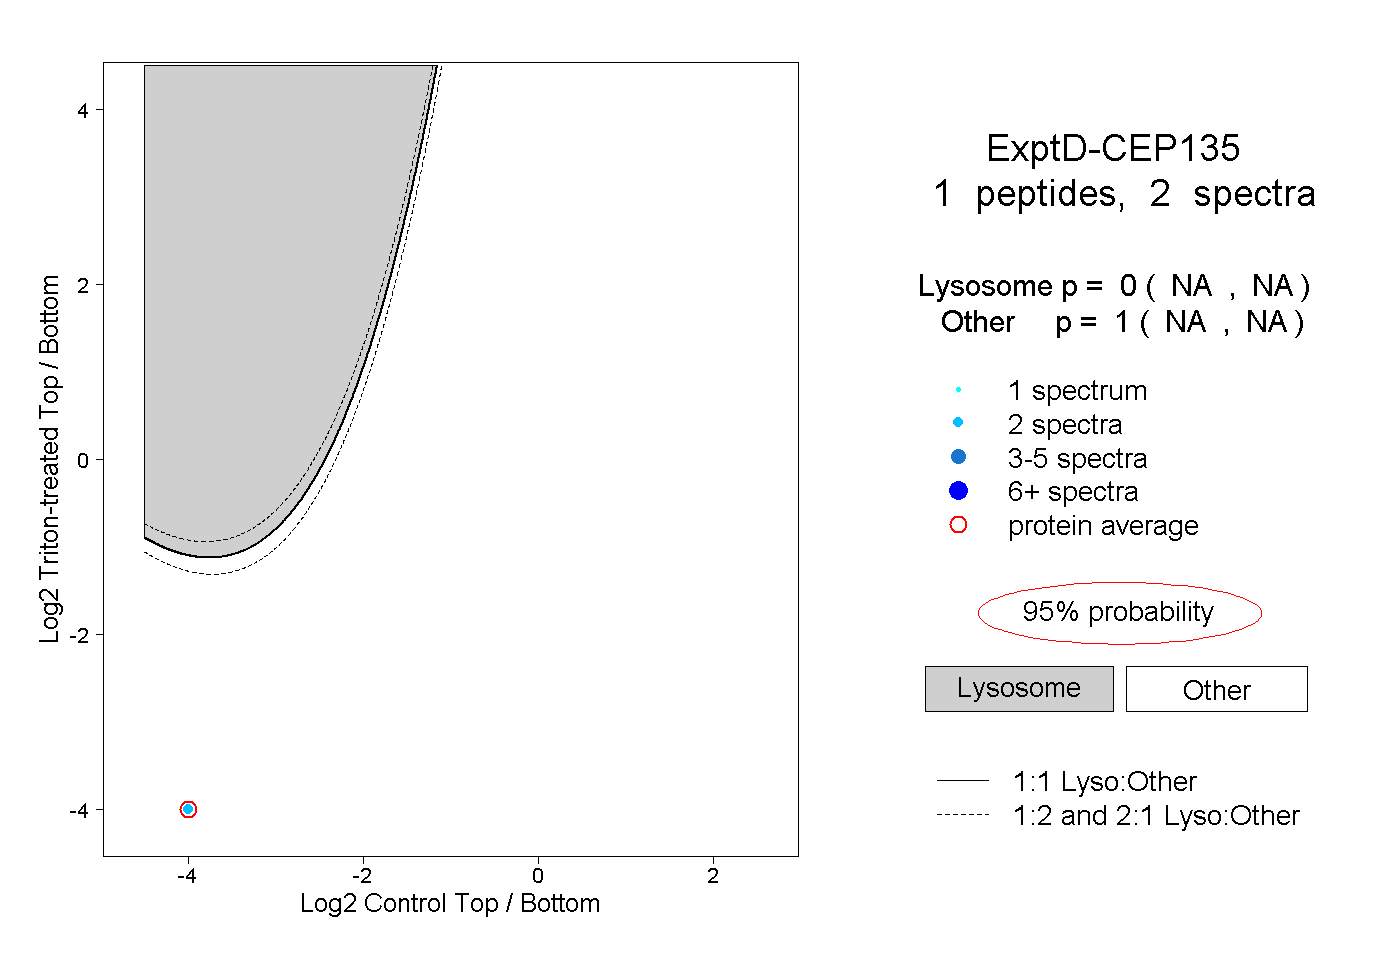
NA | NA
NA | NA