 3
3peptides
spectra
0.000 | 0.100
0.000 | 0.000
0.000 | 0.113
0.000 | 0.113
0.000 | 0.029
0.197 | 0.407
0.489 | 0.561
0.000 | 0.006
| Plot | Mito | Lyso | Perox | ER | Golgi | PM | Cytosol | Nucleus | |||||
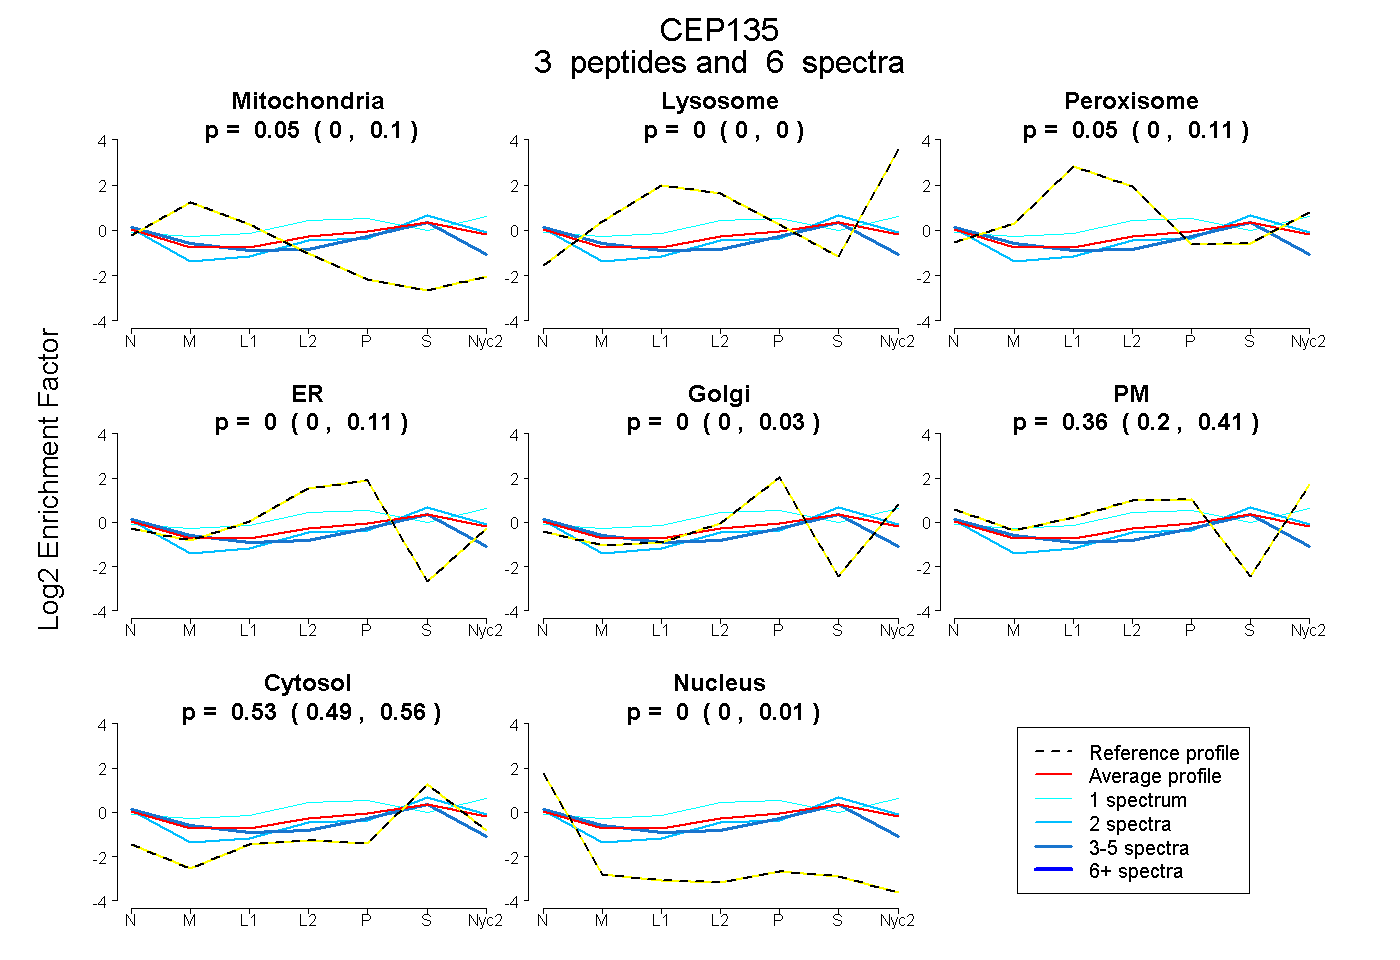
| Expt A |
3 peptides |
6 spectra |
|
0.055 0.000 | 0.100 |
0.000 0.000 | 0.000 |
0.055 0.000 | 0.113 |
0.003 0.000 | 0.113 |
0.000 0.000 | 0.029 |
0.356 0.197 | 0.407 |
0.532 0.489 | 0.561 |
0.000 0.000 | 0.006 |
| 3 spectra, LQHLIQR | 0.208 | 0.000 | 0.000 | 0.081 | 0.002 | 0.153 | 0.546 | 0.011 | ||
| 2 spectra, IQEIEEK | 0.000 | 0.000 | 0.000 | 0.000 | 0.000 | 0.337 | 0.656 | 0.007 | ||
| 1 spectrum, EELSALR | 0.000 | 0.007 | 0.232 | 0.000 | 0.122 | 0.327 | 0.312 | 0.000 |
| Plot | Mito | Lyso or Perox | ER | Golgi | PM | Cytosol | Nucleus | ||||||
| Expt B |
1 peptide |
2 spectra |
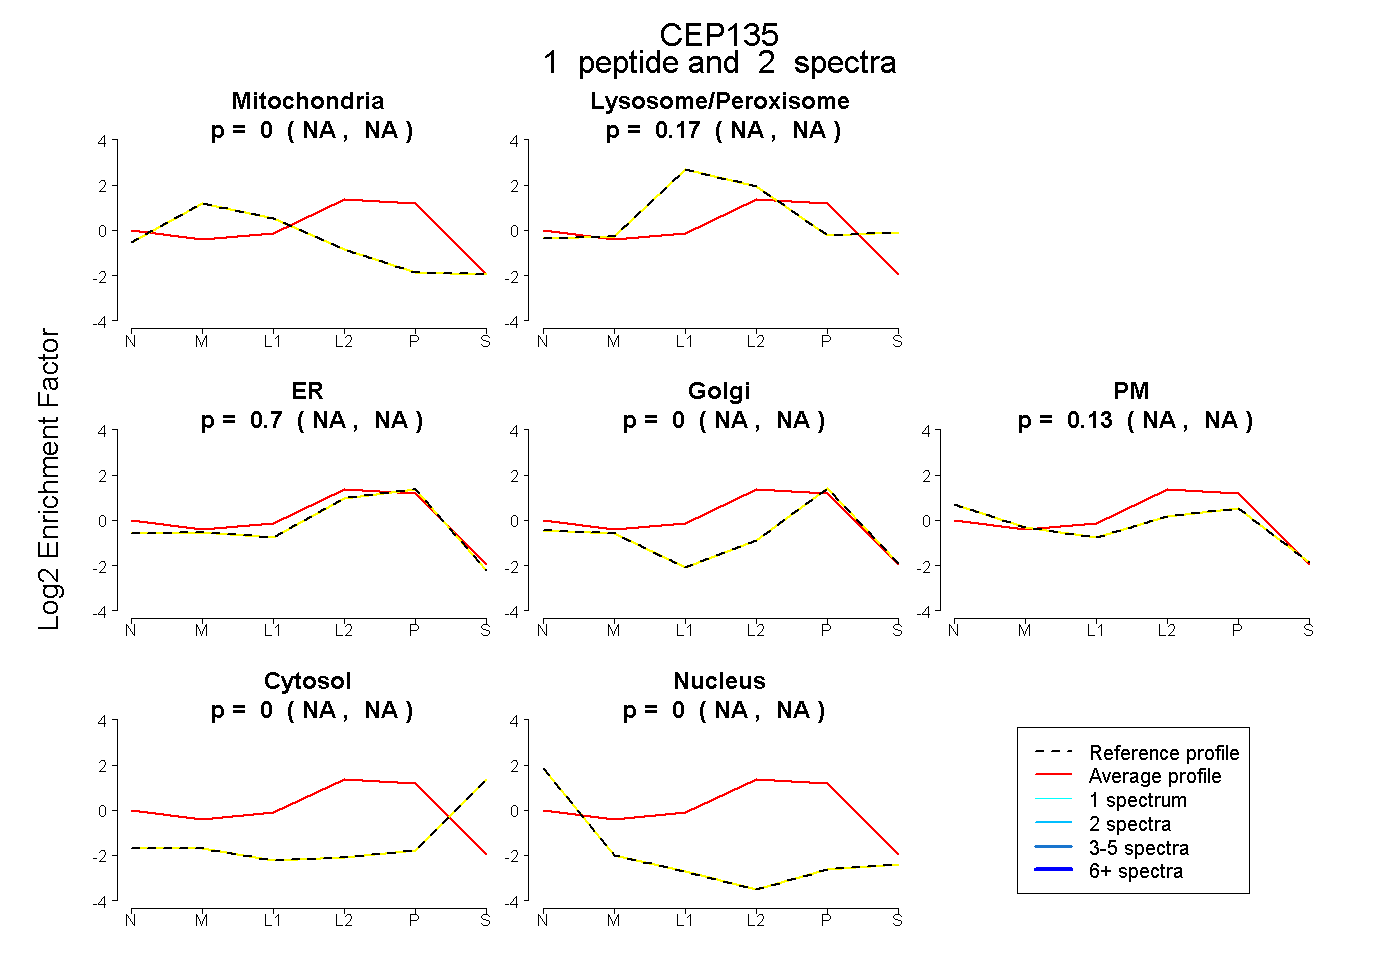 |
0.000 NA | NA |
0.170 NA | NA |
0.697 NA | NA |
0.000 NA | NA |
0.133 NA | NA |
0.000 NA | NA |
0.000 NA | NA |
|||
| Plot | Lyso | Other | |||||||||||
| Expt C |
1 peptide |
2 spectra |
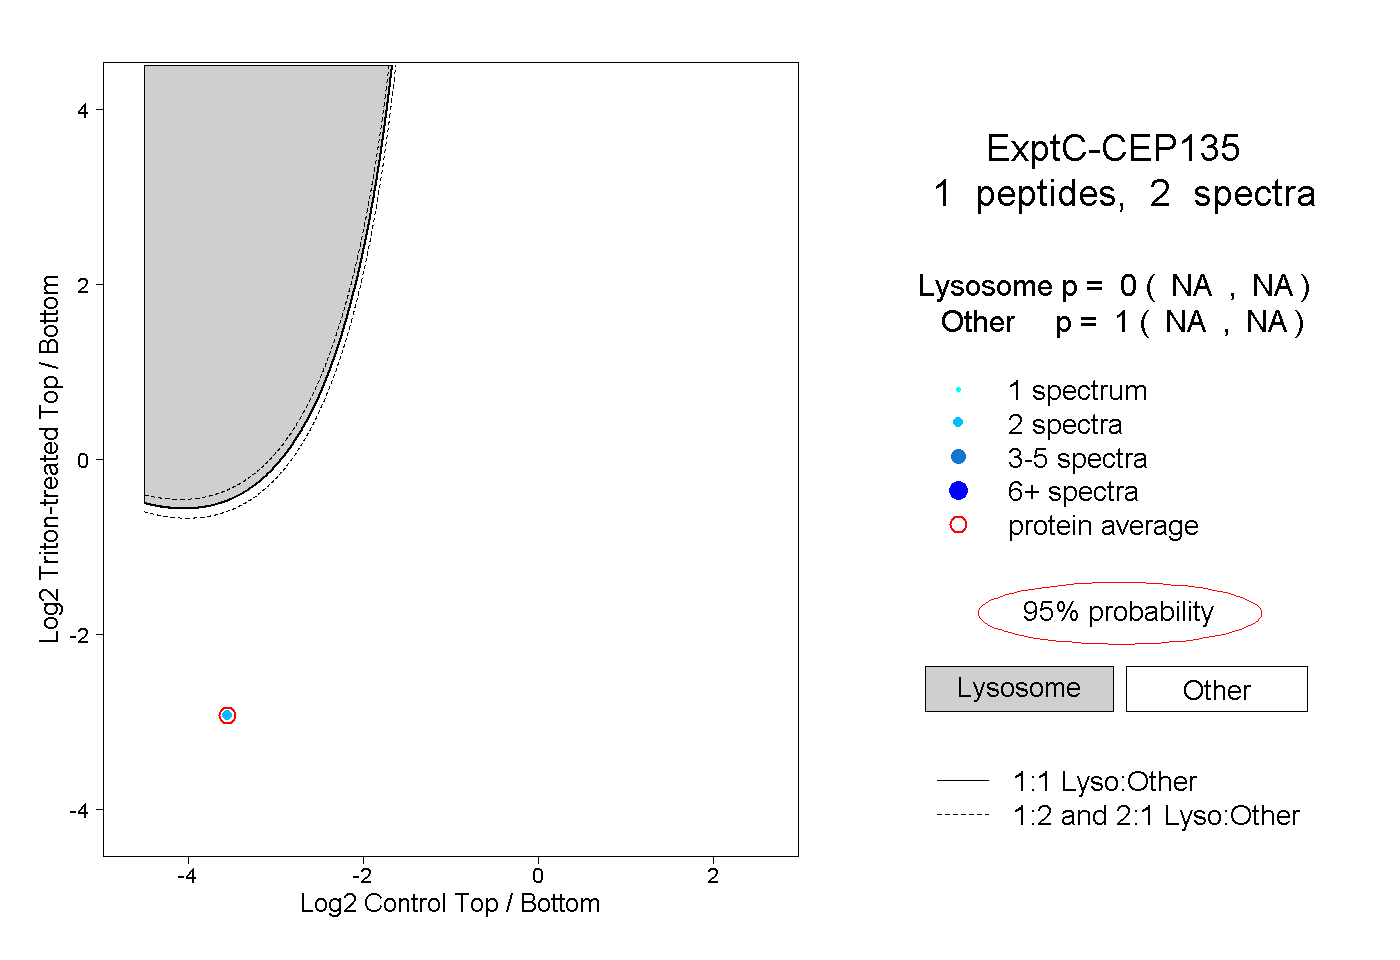 |
0.000 NA | NA |
1.000 NA | NA |
||||||||
| Plot | Lyso | Other | |||||||||||
| Expt D |
1 peptide |
2 spectra |
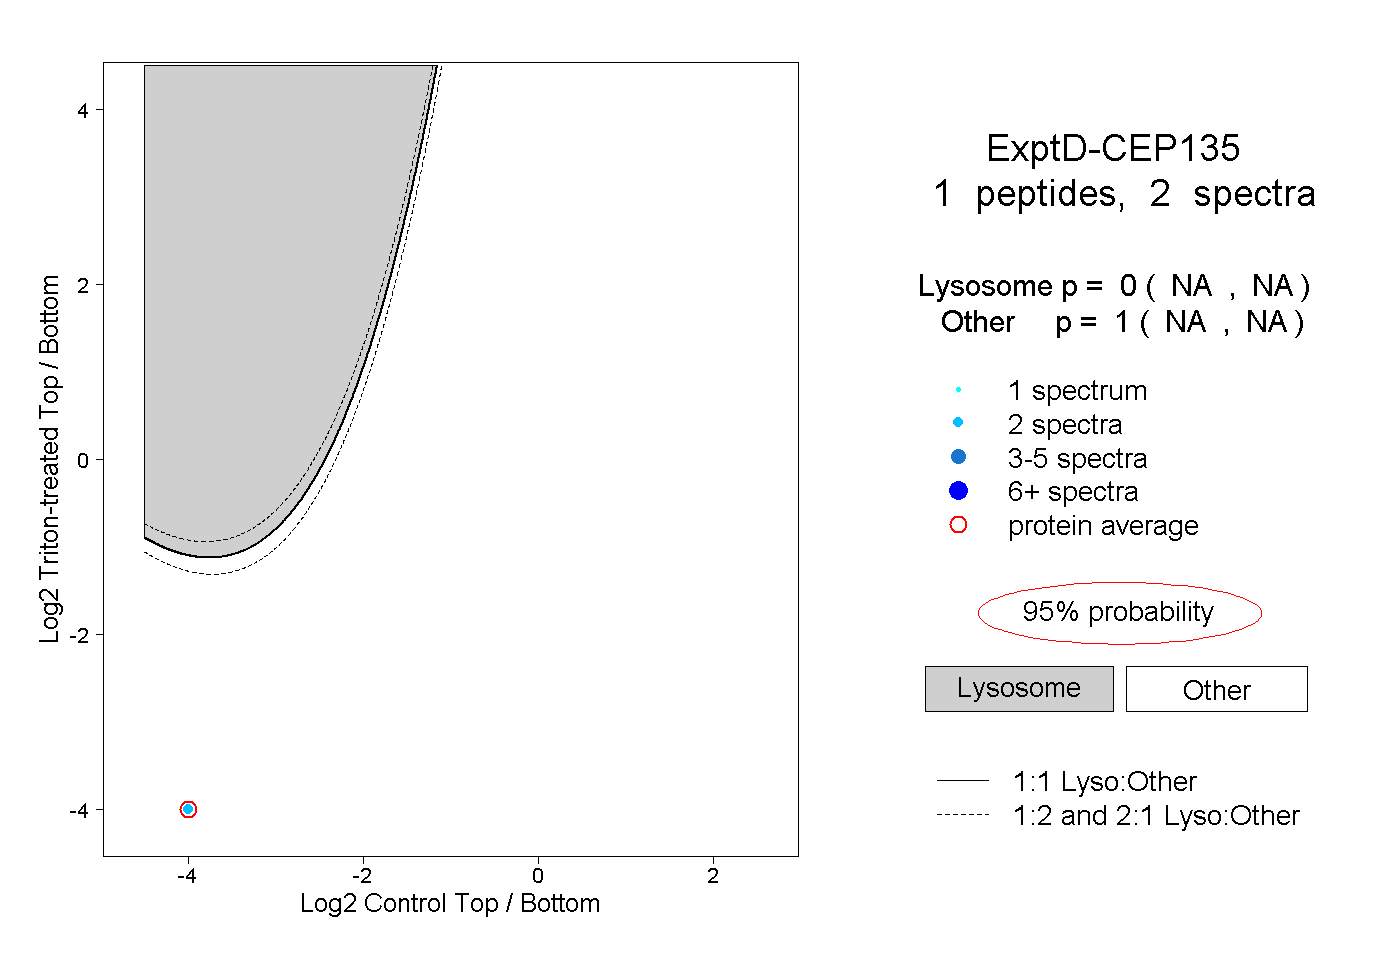 |
0.000 NA | NA |
1.000 NA | NA |