 8
8peptides
spectra
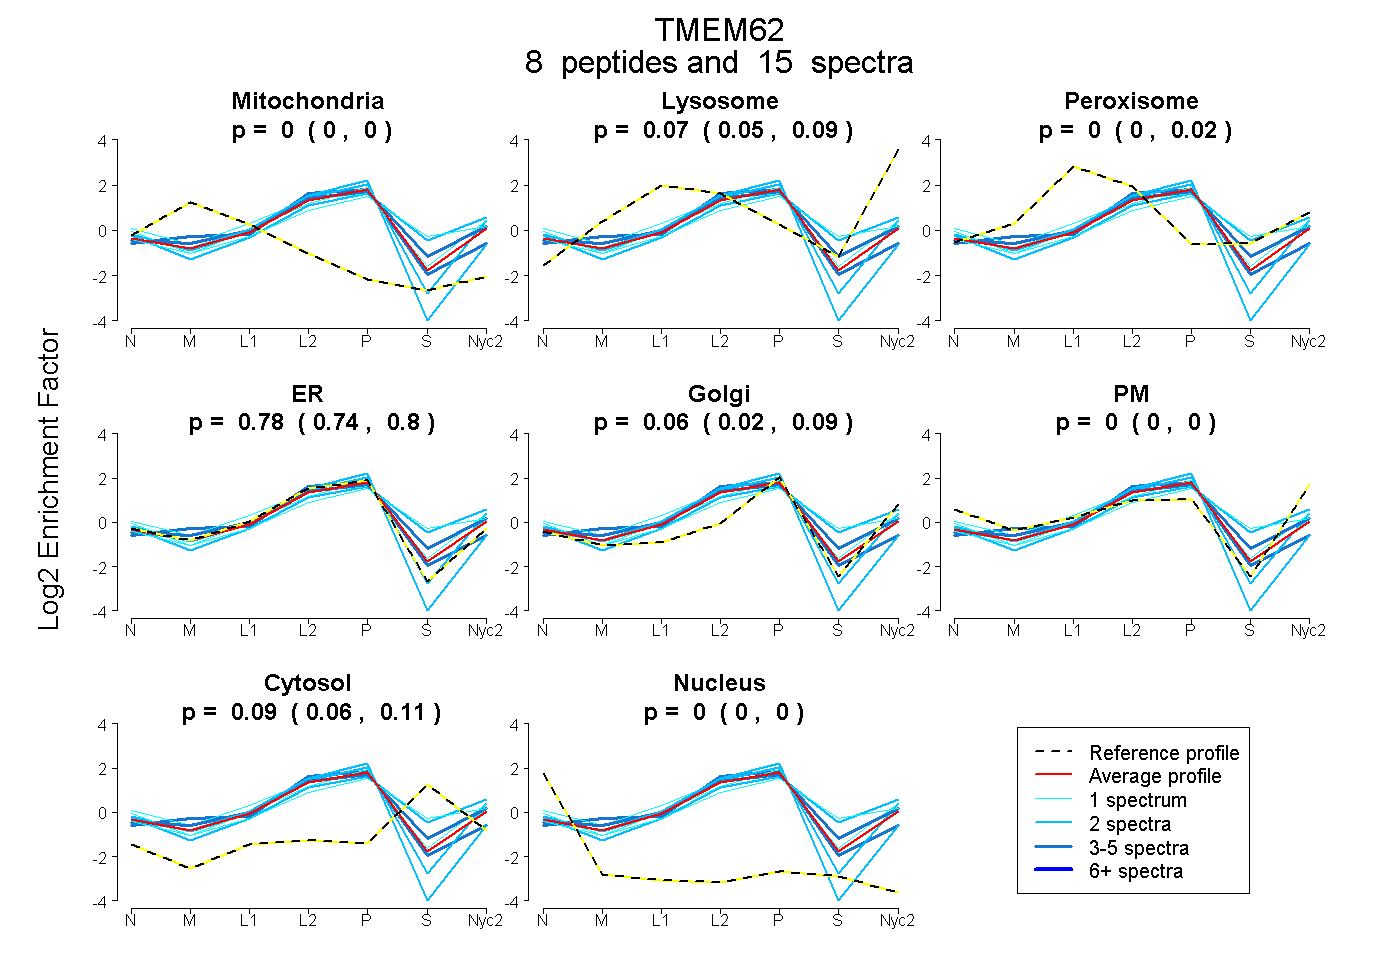
0.000 | 0.000
0.050 | 0.088
0.000 | 0.016
0.738 | 0.799
0.025 | 0.095
0.000 | 0.003
0.062 | 0.108
0.000 | 0.000
1peptide
spectrum
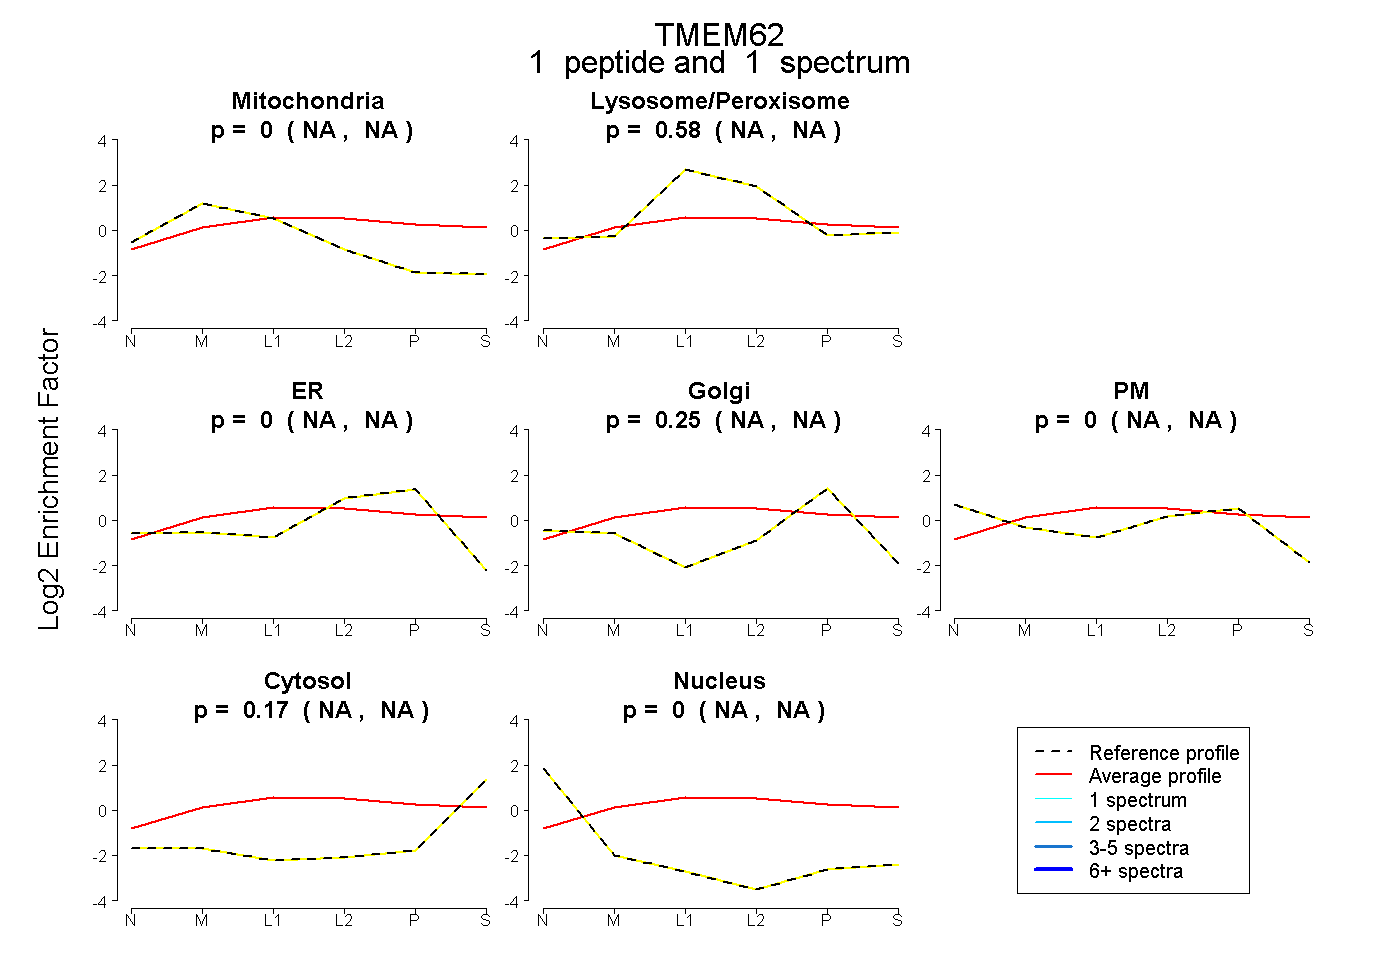
NA | NA
NA | NA
NA | NA
NA | NA
NA | NA
NA | NA
NA | NA
6peptides
spectra
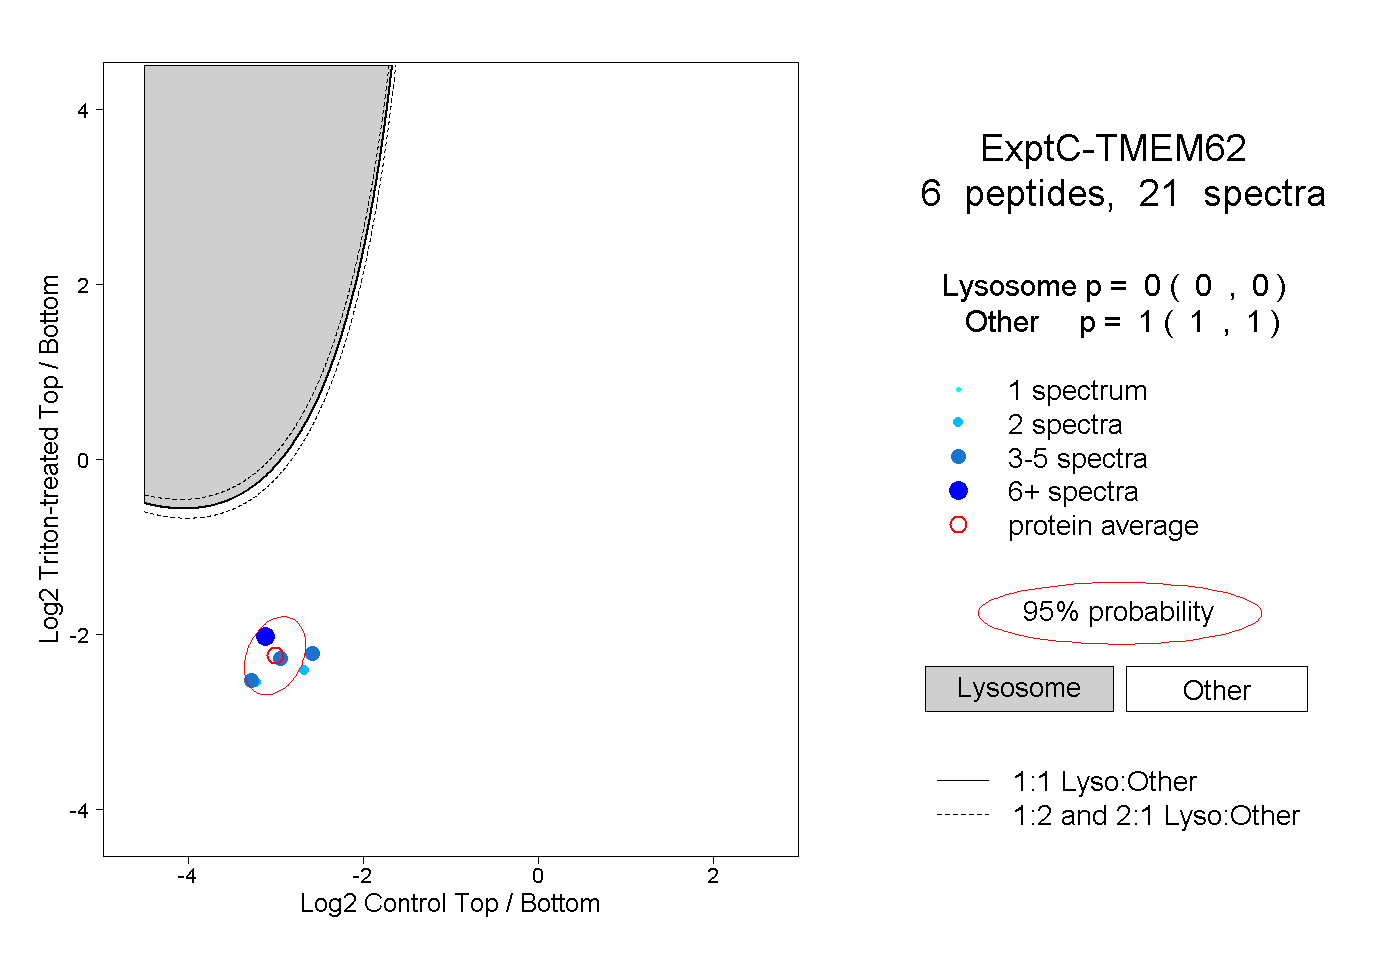
0.000 | 0.000
1.000 | 1.000