 8
8peptides
spectra
0.000 | 0.000
0.050 | 0.088
0.000 | 0.016
0.738 | 0.799
0.025 | 0.095
0.000 | 0.003
0.062 | 0.108
0.000 | 0.000
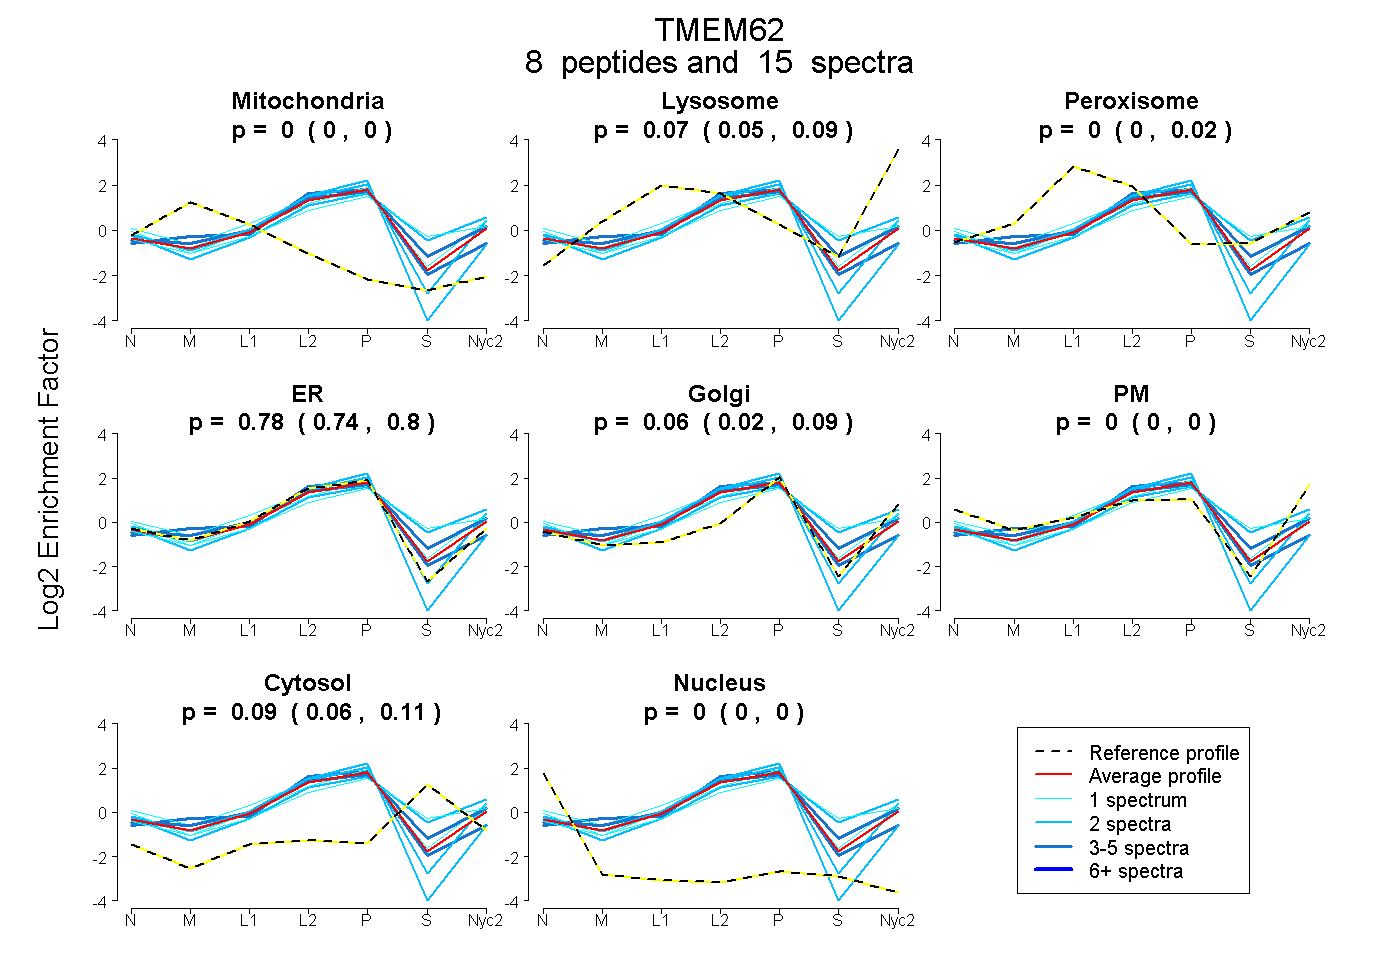
| Plot | Mito | Lyso | Perox | ER | Golgi | PM | Cytosol | Nucleus | |||||
| Expt A |
8 peptides |
15 spectra |
|
0.000 0.000 | 0.000 |
0.074 0.050 | 0.088 |
0.000 0.000 | 0.016 |
0.775 0.738 | 0.799 |
0.062 0.025 | 0.095 |
0.000 0.000 | 0.003 |
0.089 0.062 | 0.108 |
0.000 0.000 | 0.000 |
| 1 spectrum, QMEELLSFSK | 0.000 | 0.000 | 0.152 | 0.516 | 0.091 | 0.205 | 0.037 | 0.000 | ||
| 1 spectrum, RPYNFFGILNEK | 0.000 | 0.000 | 0.039 | 0.650 | 0.161 | 0.082 | 0.067 | 0.000 | ||
| 2 spectra, HEPLER | 0.000 | 0.004 | 0.000 | 0.707 | 0.131 | 0.159 | 0.000 | 0.000 | ||
| 1 spectrum, WPVALITNPK | 0.000 | 0.103 | 0.039 | 0.482 | 0.089 | 0.000 | 0.288 | 0.000 | ||
| 2 spectra, SLLYSCAK | 0.000 | 0.000 | 0.000 | 0.998 | 0.000 | 0.000 | 0.000 | 0.002 | ||
| 3 spectra, CFGHNFR | 0.014 | 0.000 | 0.035 | 0.897 | 0.000 | 0.000 | 0.053 | 0.000 | ||
| 2 spectra, ALALEK | 0.000 | 0.135 | 0.000 | 0.450 | 0.108 | 0.061 | 0.246 | 0.000 | ||
| 3 spectra, SHLLQGR | 0.000 | 0.135 | 0.021 | 0.706 | 0.000 | 0.000 | 0.139 | 0.000 |
| Plot | Mito | Lyso or Perox | ER | Golgi | PM | Cytosol | Nucleus | ||||||
| Expt B |
1 peptide |
1 spectrum |
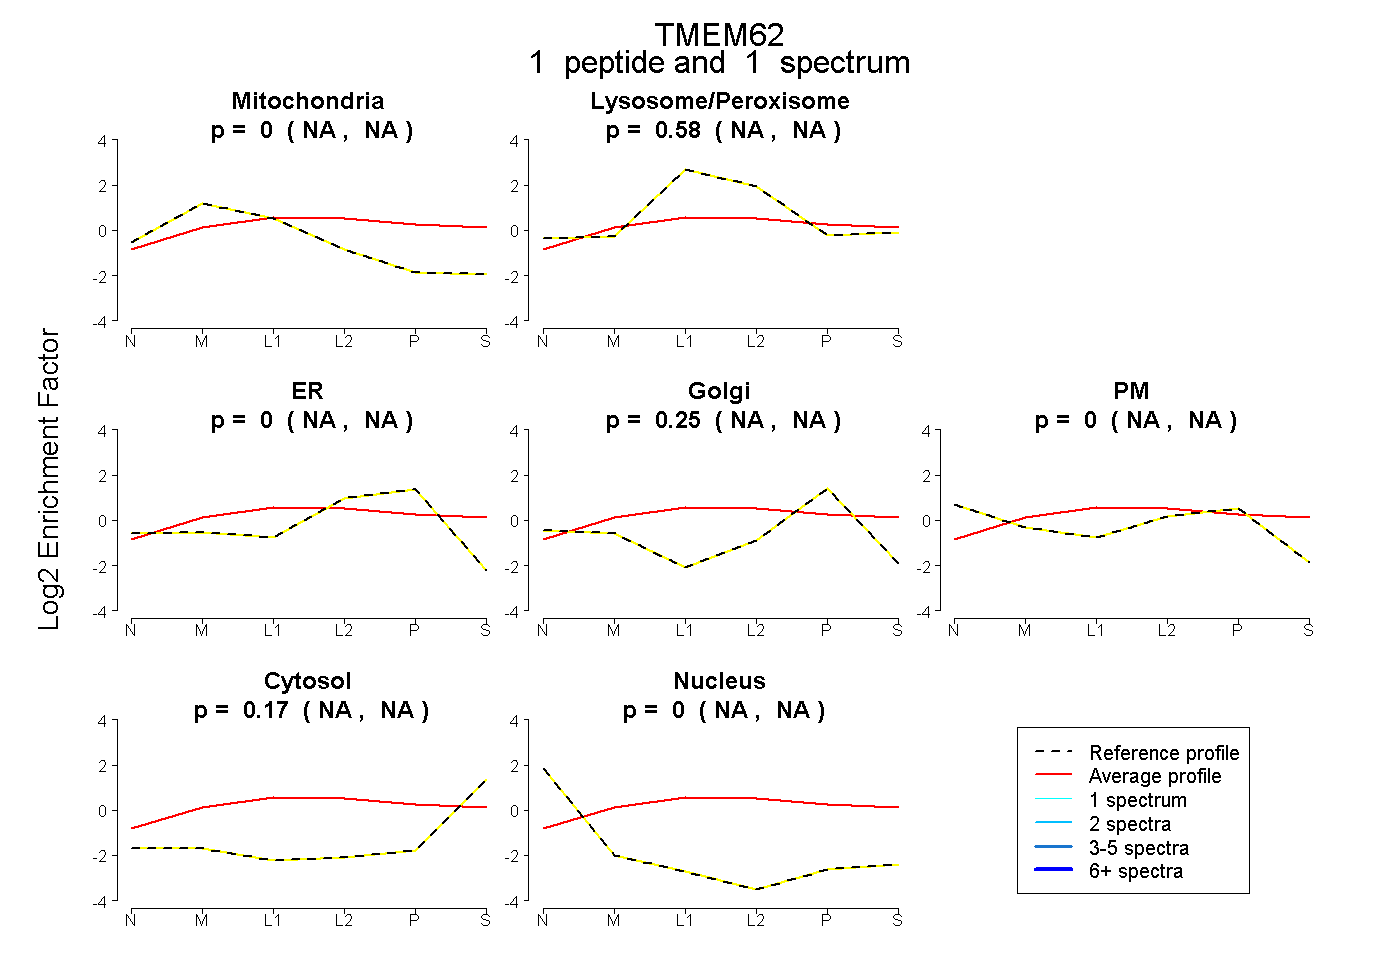 |
0.000 NA | NA |
0.580 NA | NA |
0.000 NA | NA |
0.253 NA | NA |
0.000 NA | NA |
0.167 NA | NA |
0.000 NA | NA |
|||
| Plot | Lyso | Other | |||||||||||
| Expt C |
6 peptides |
21 spectra |
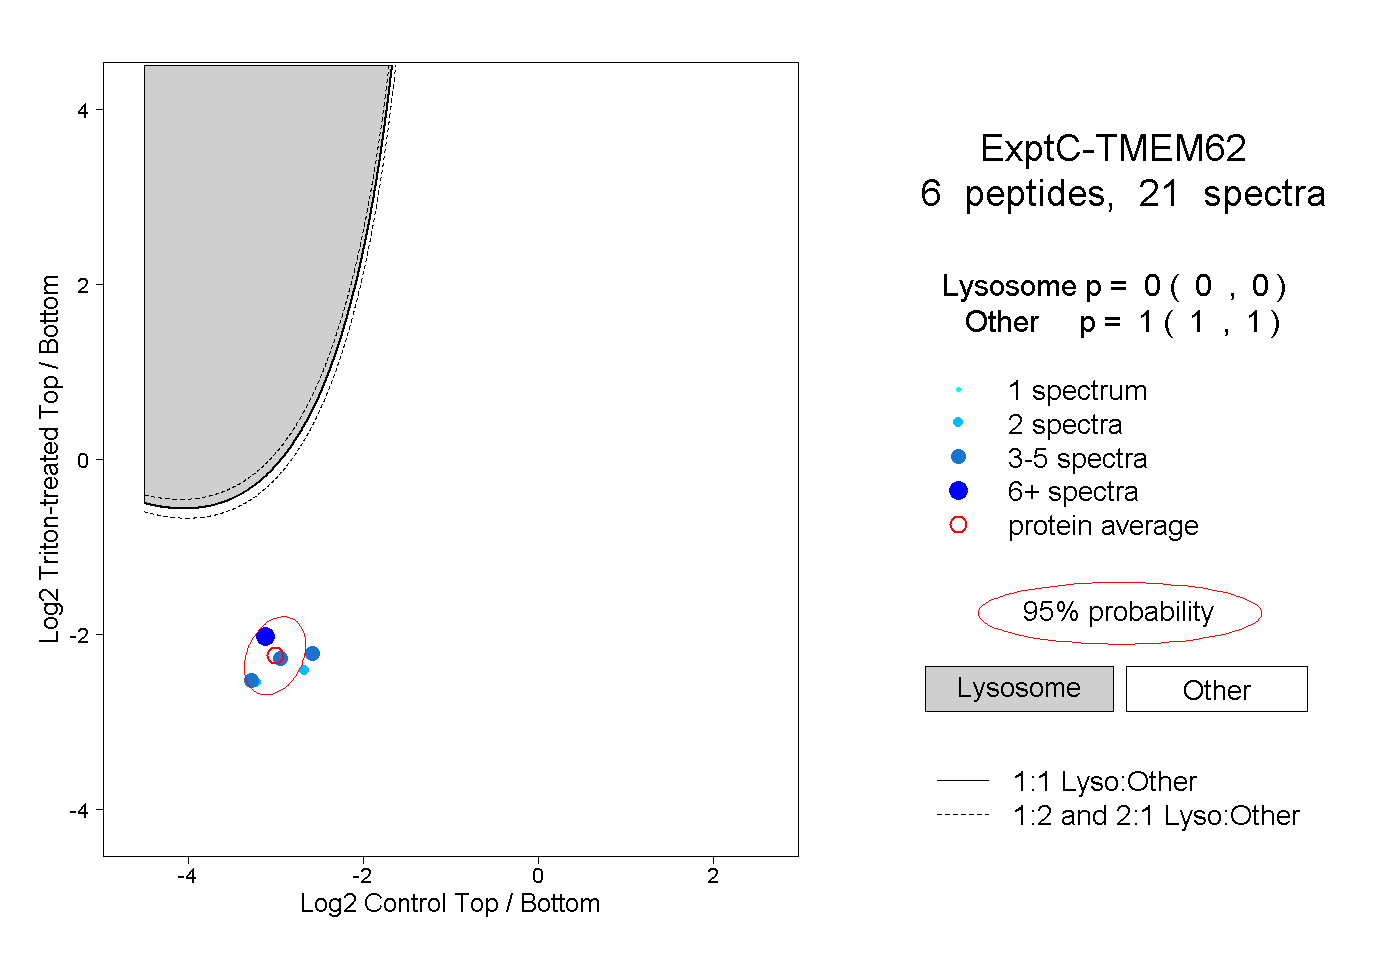 |
0.000 0.000 | 0.000 |
1.000 1.000 | 1.000 |