 5
5peptides
spectra
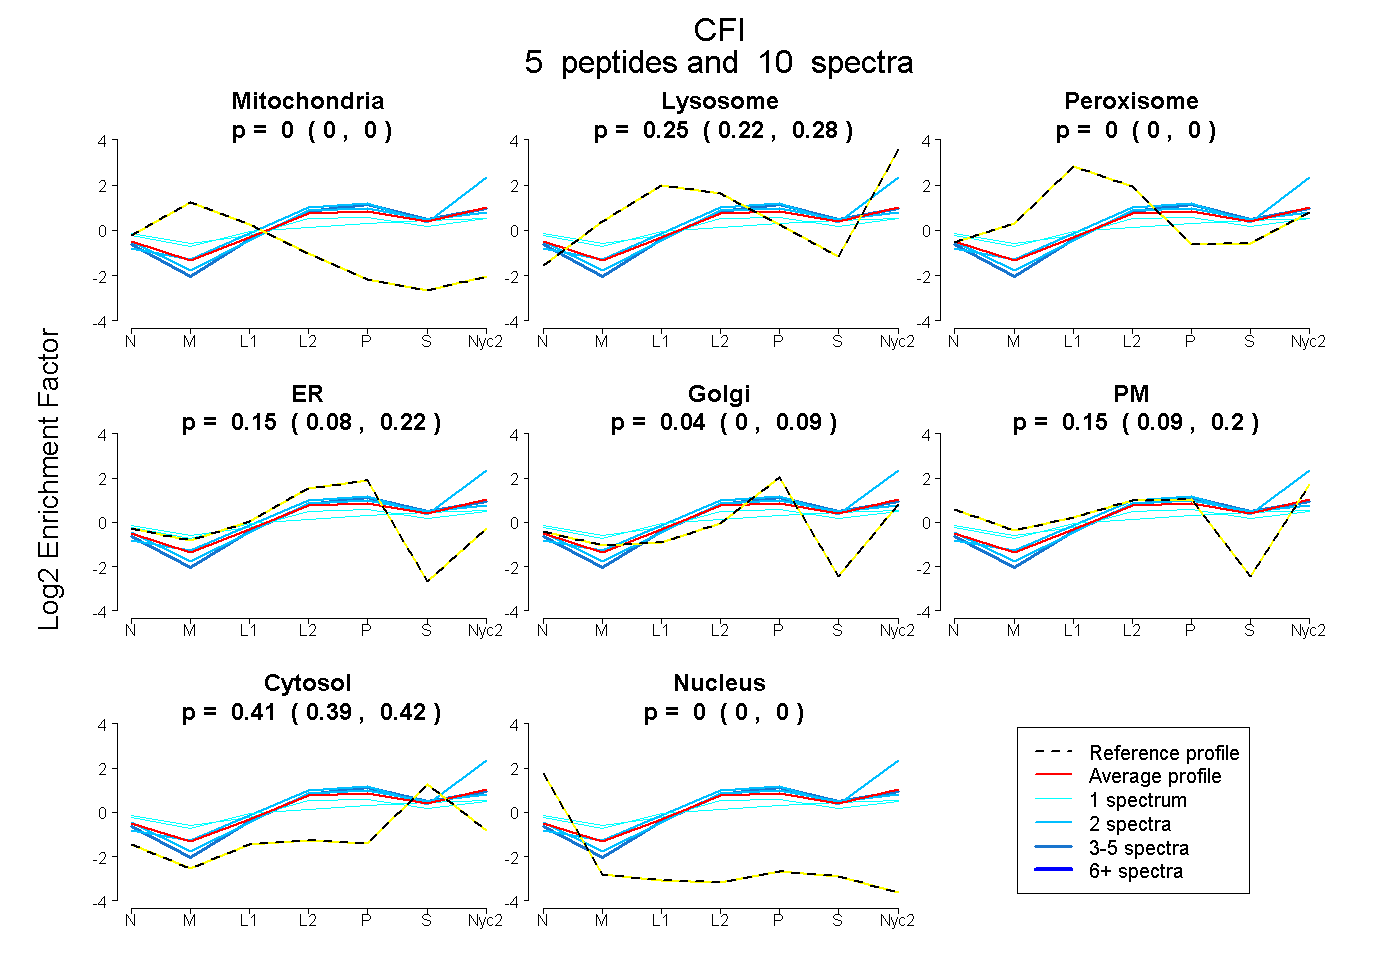
0.000 | 0.000
0.223 | 0.277
0.000 | 0.000
0.079 | 0.217
0.000 | 0.090
0.085 | 0.199
0.388 | 0.424
0.000 | 0.000
5peptides
spectra
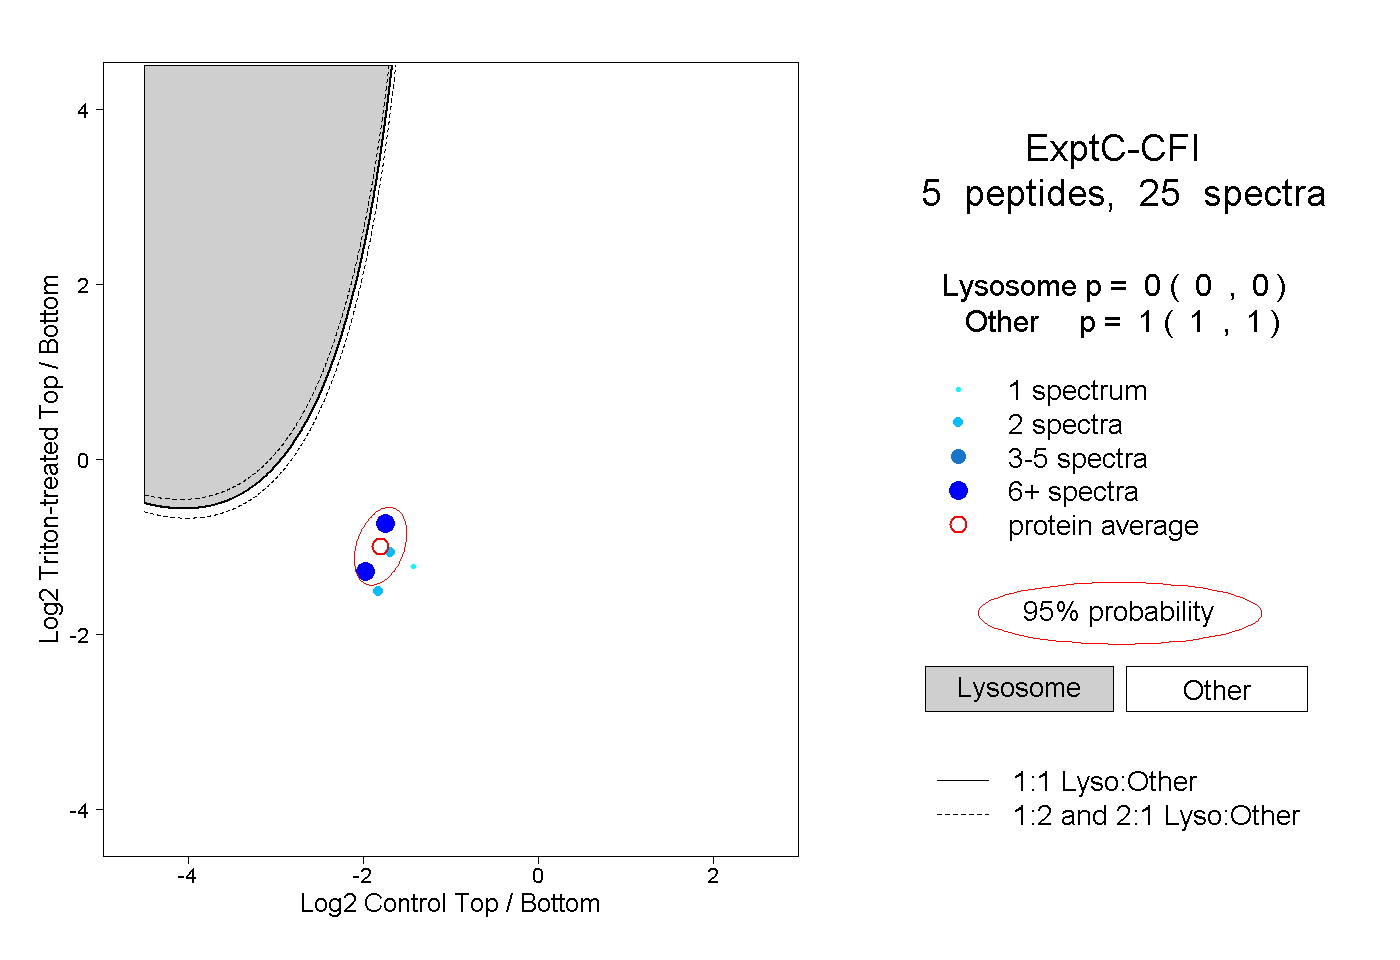
0.000 | 0.000
1.000 | 1.000
2peptides
spectra
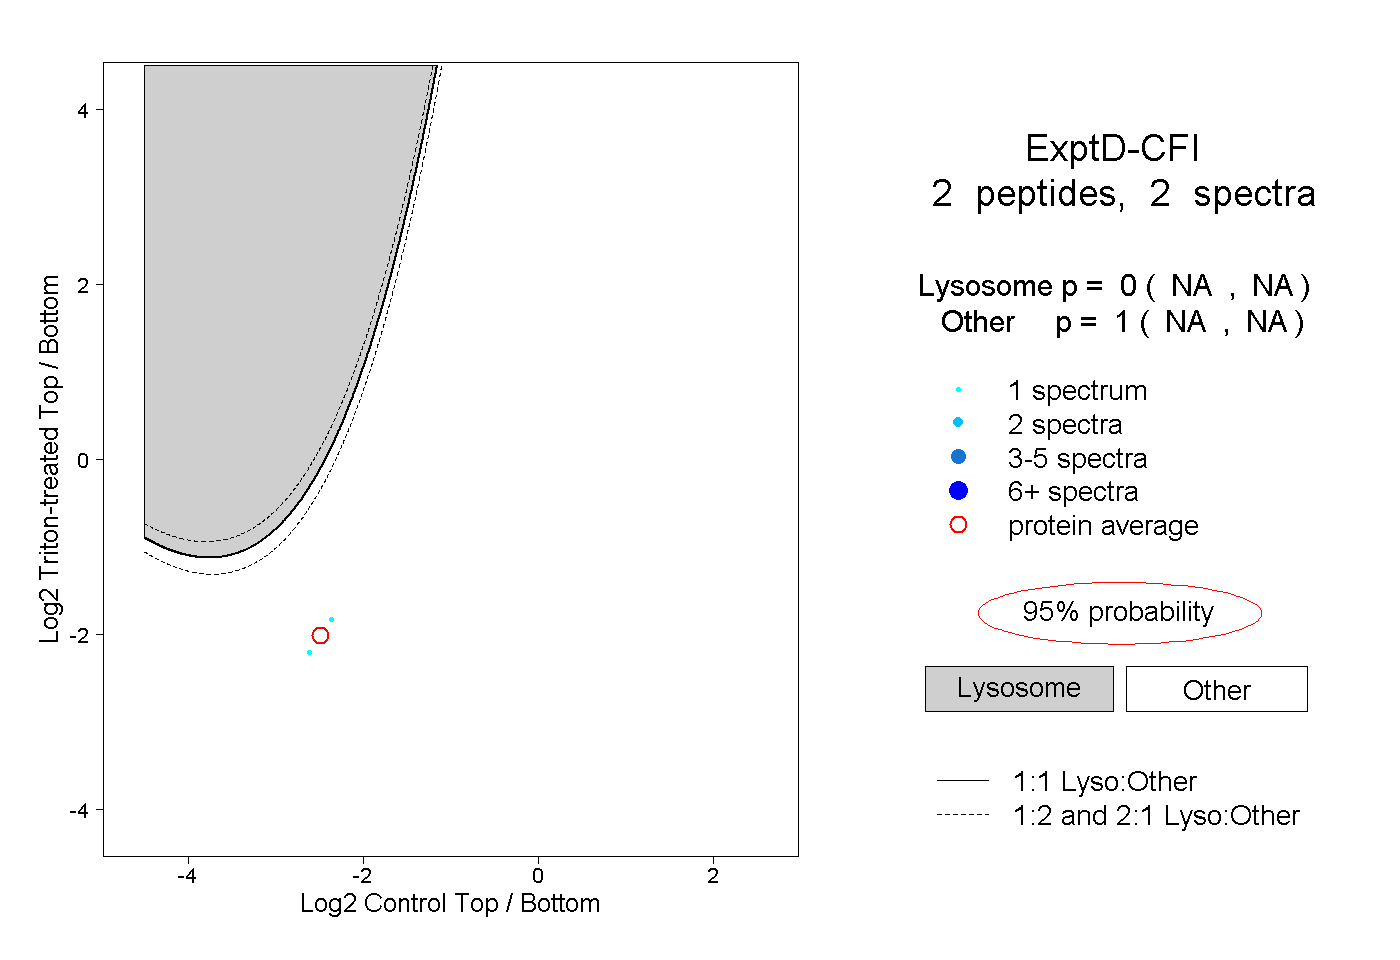
NA | NA
NA | NA