 5
5peptides
spectra
0.000 | 0.000
0.223 | 0.277
0.000 | 0.000
0.079 | 0.217
0.000 | 0.090
0.085 | 0.199
0.388 | 0.424
0.000 | 0.000
| Plot | Mito | Lyso | Perox | ER | Golgi | PM | Cytosol | Nucleus | |||||
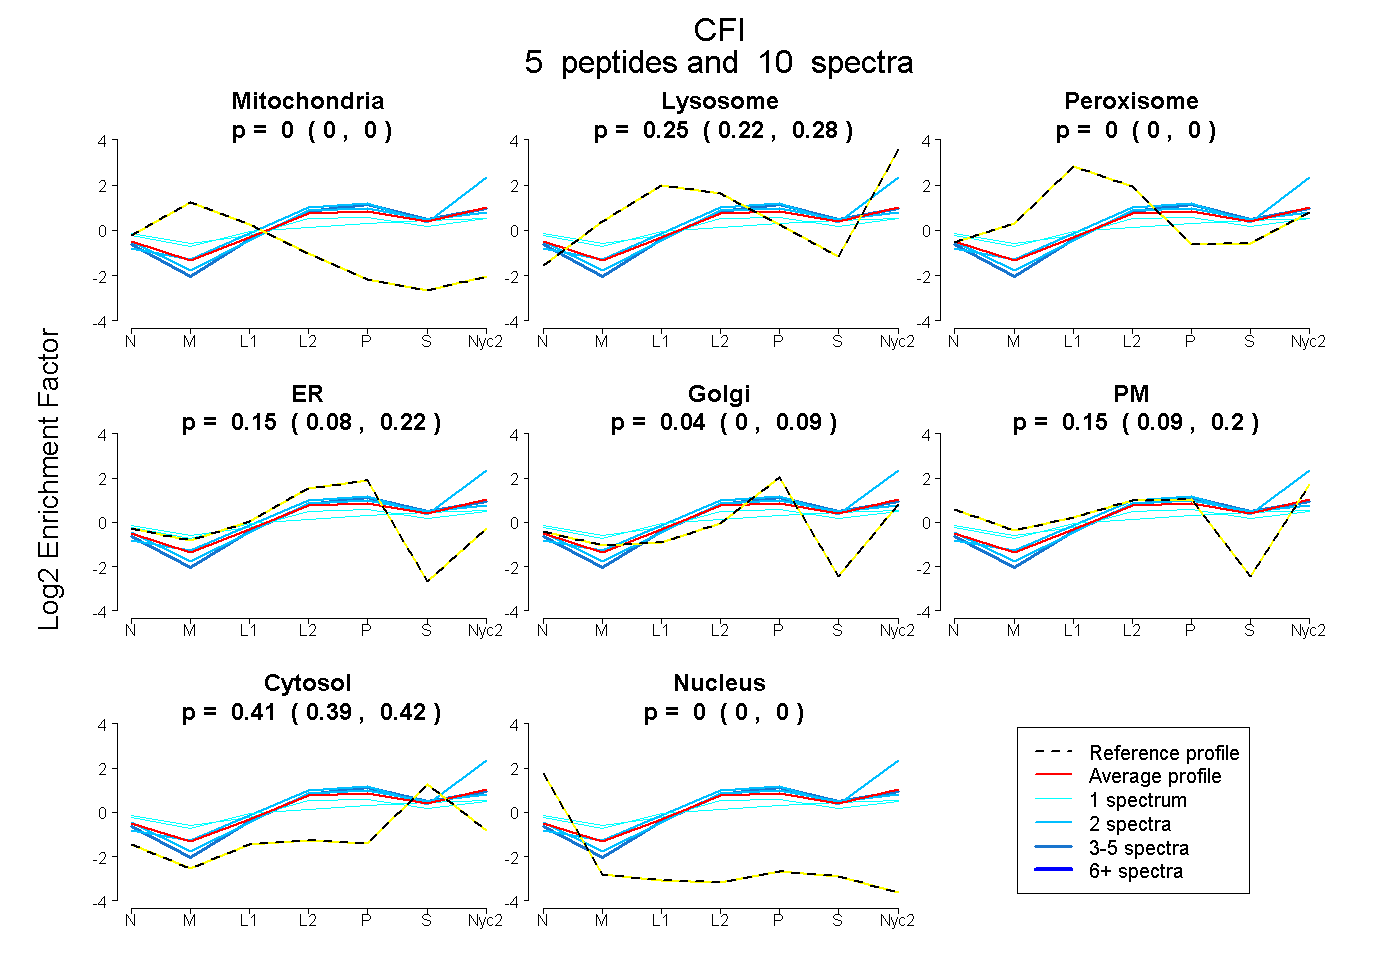
| Expt A |
5 peptides |
10 spectra |
|
0.000 0.000 | 0.000 |
0.252 0.223 | 0.277 |
0.000 0.000 | 0.000 |
0.155 0.079 | 0.217 |
0.038 0.000 | 0.090 |
0.147 0.085 | 0.199 |
0.409 0.388 | 0.424 |
0.000 0.000 | 0.000 |
| 2 spectra, LSCGVK | 0.000 | 0.484 | 0.000 | 0.000 | 0.247 | 0.000 | 0.269 | 0.000 | ||
| 2 spectra, VVVHEK | 0.000 | 0.199 | 0.000 | 0.254 | 0.042 | 0.069 | 0.436 | 0.000 | ||
| 1 spectrum, EMQCAGTSDGSIDACK | 0.000 | 0.000 | 0.232 | 0.000 | 0.138 | 0.283 | 0.347 | 0.000 | ||
| 1 spectrum, YNGATYQNDIALVEMK | 0.000 | 0.044 | 0.209 | 0.000 | 0.064 | 0.257 | 0.426 | 0.000 | ||
| 4 spectra, CIISGWGR | 0.000 | 0.233 | 0.000 | 0.198 | 0.148 | 0.000 | 0.421 | 0.000 |
| Plot | Lyso | Other | |||||||||||
| Expt C |
5 peptides |
25 spectra |
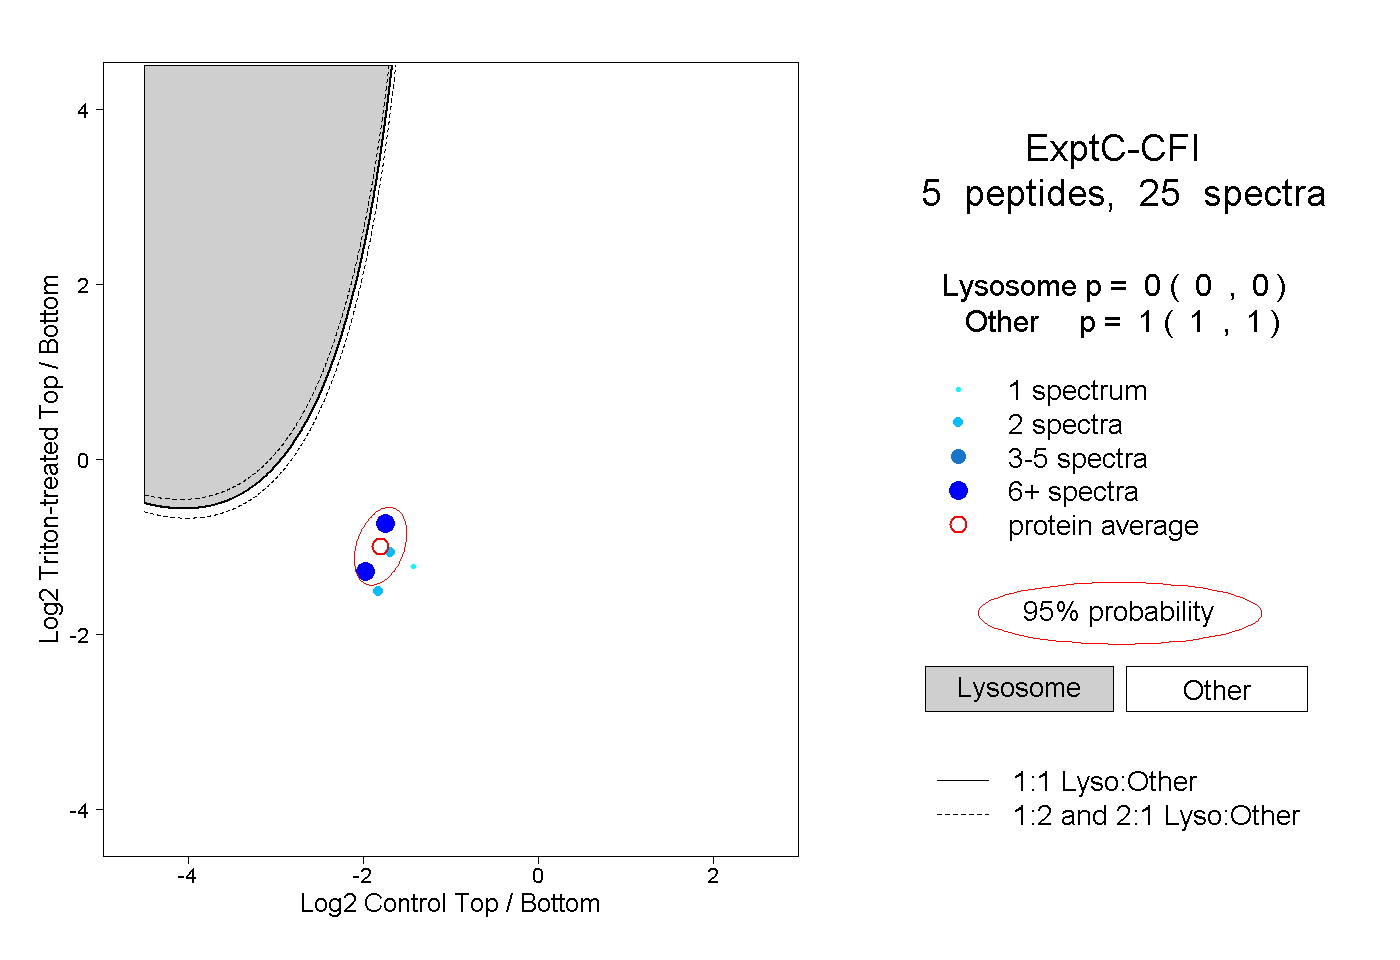 |
0.000 0.000 | 0.000 |
1.000 1.000 | 1.000 |
||||||||
| Plot | Lyso | Other | |||||||||||
| Expt D |
2 peptides |
2 spectra |
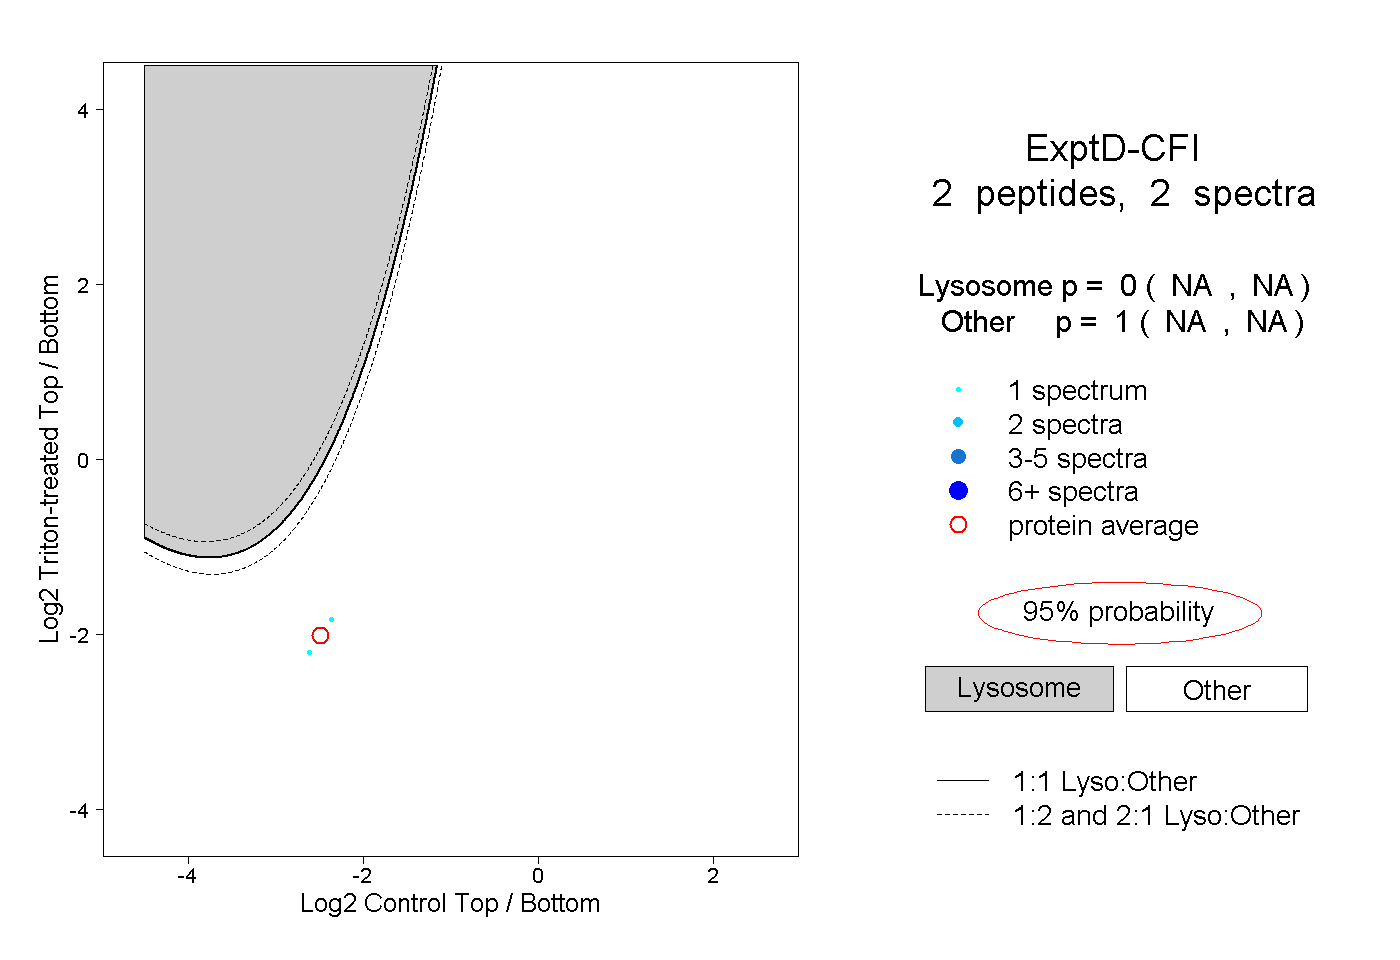 |
0.000 NA | NA |
1.000 NA | NA |