 14
14peptides
spectra
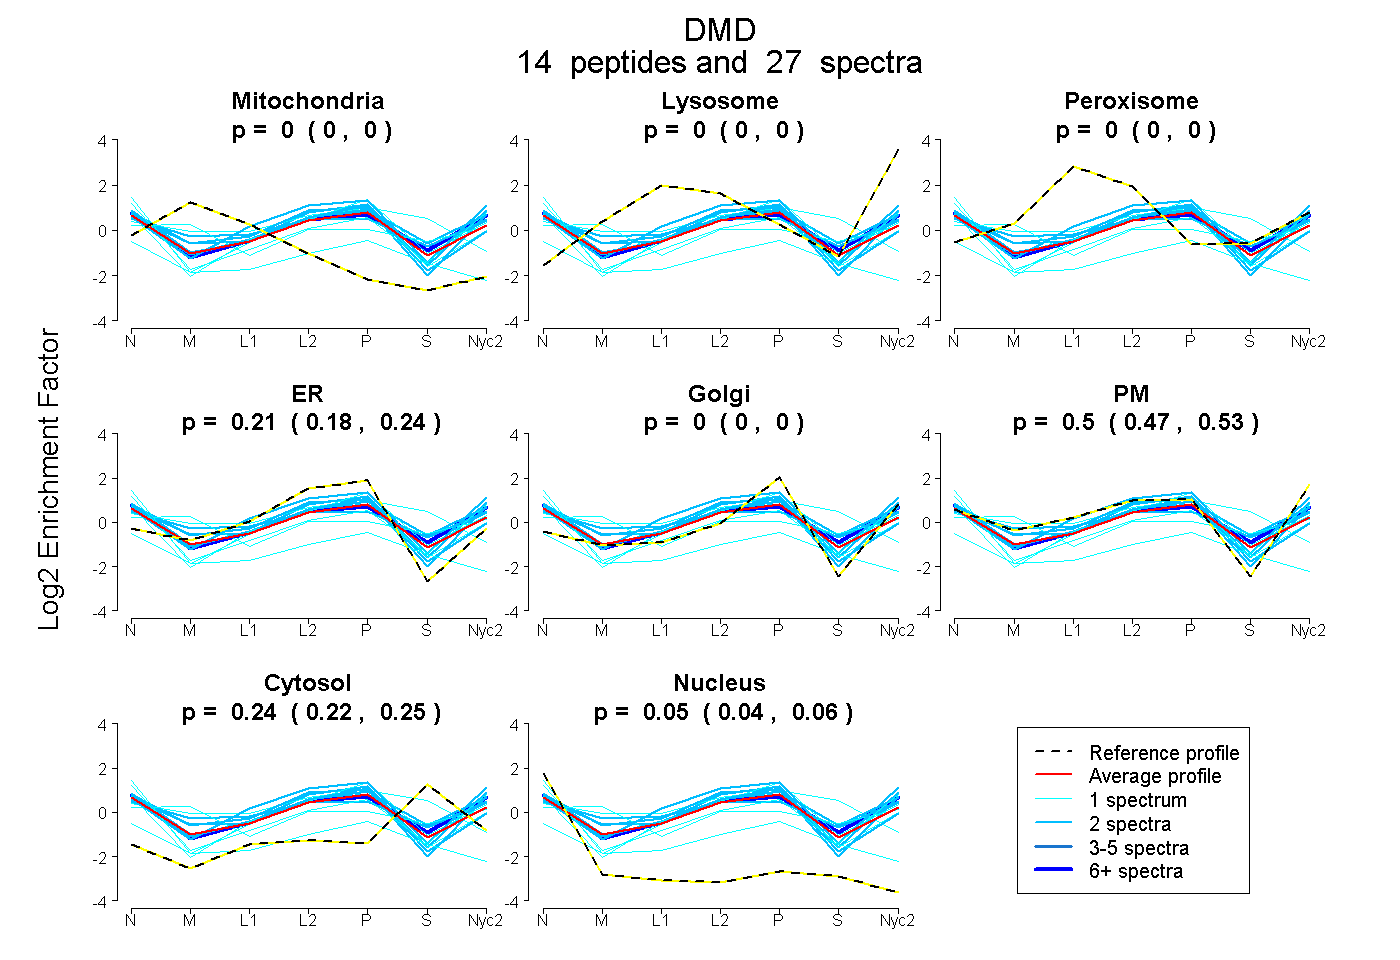
0.000 | 0.000
0.000 | 0.000
0.000 | 0.000
0.182 | 0.235
0.000 | 0.000
0.469 | 0.528
0.225 | 0.245
0.044 | 0.060
1peptide
spectra
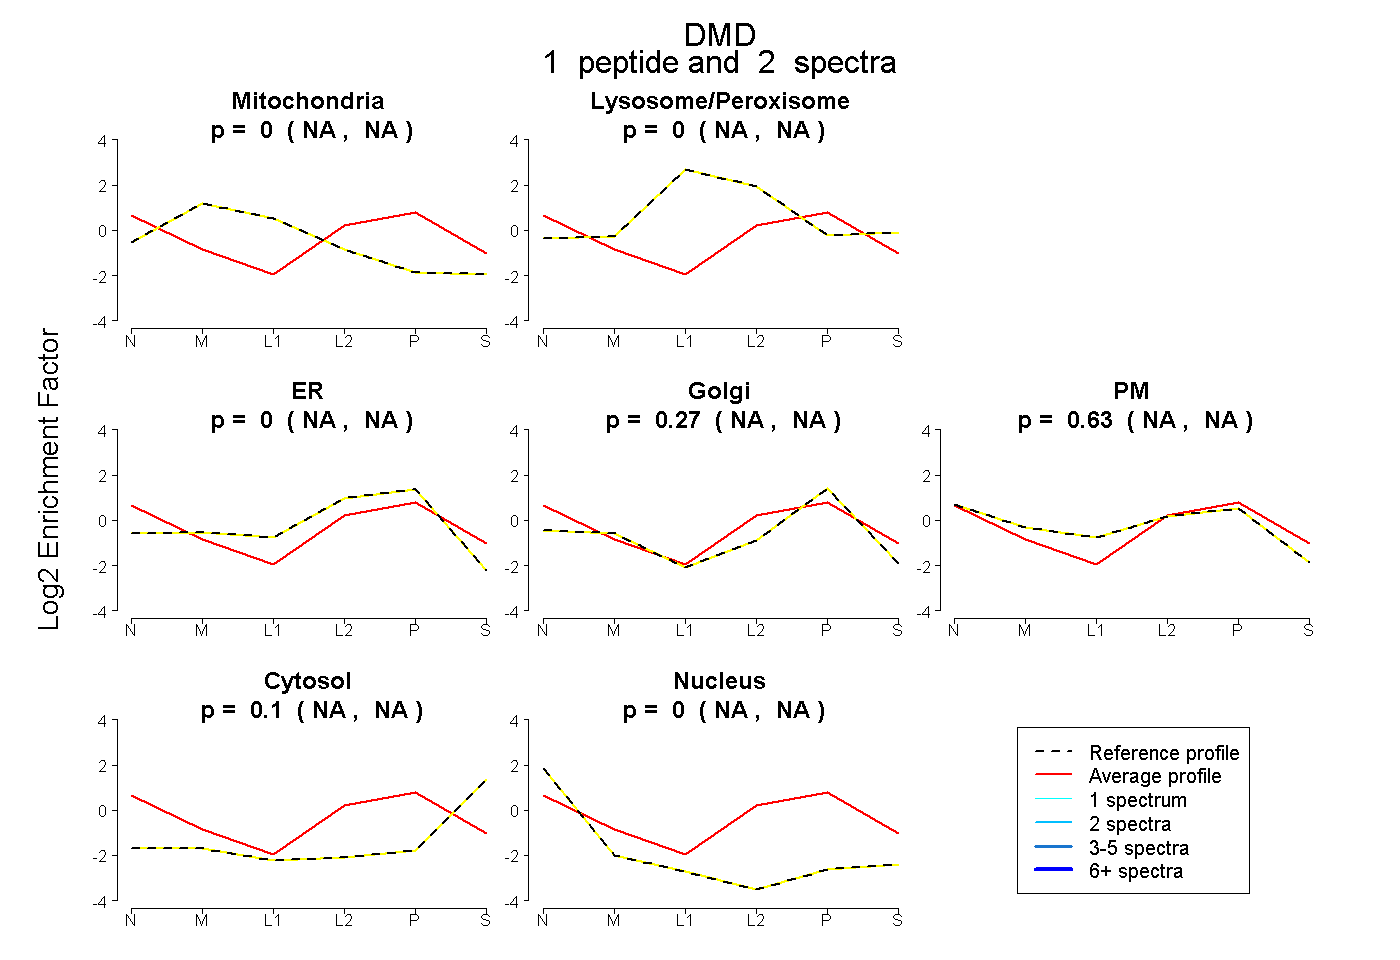
NA | NA
NA | NA
NA | NA
NA | NA
NA | NA
NA | NA
NA | NA
12peptides
spectra
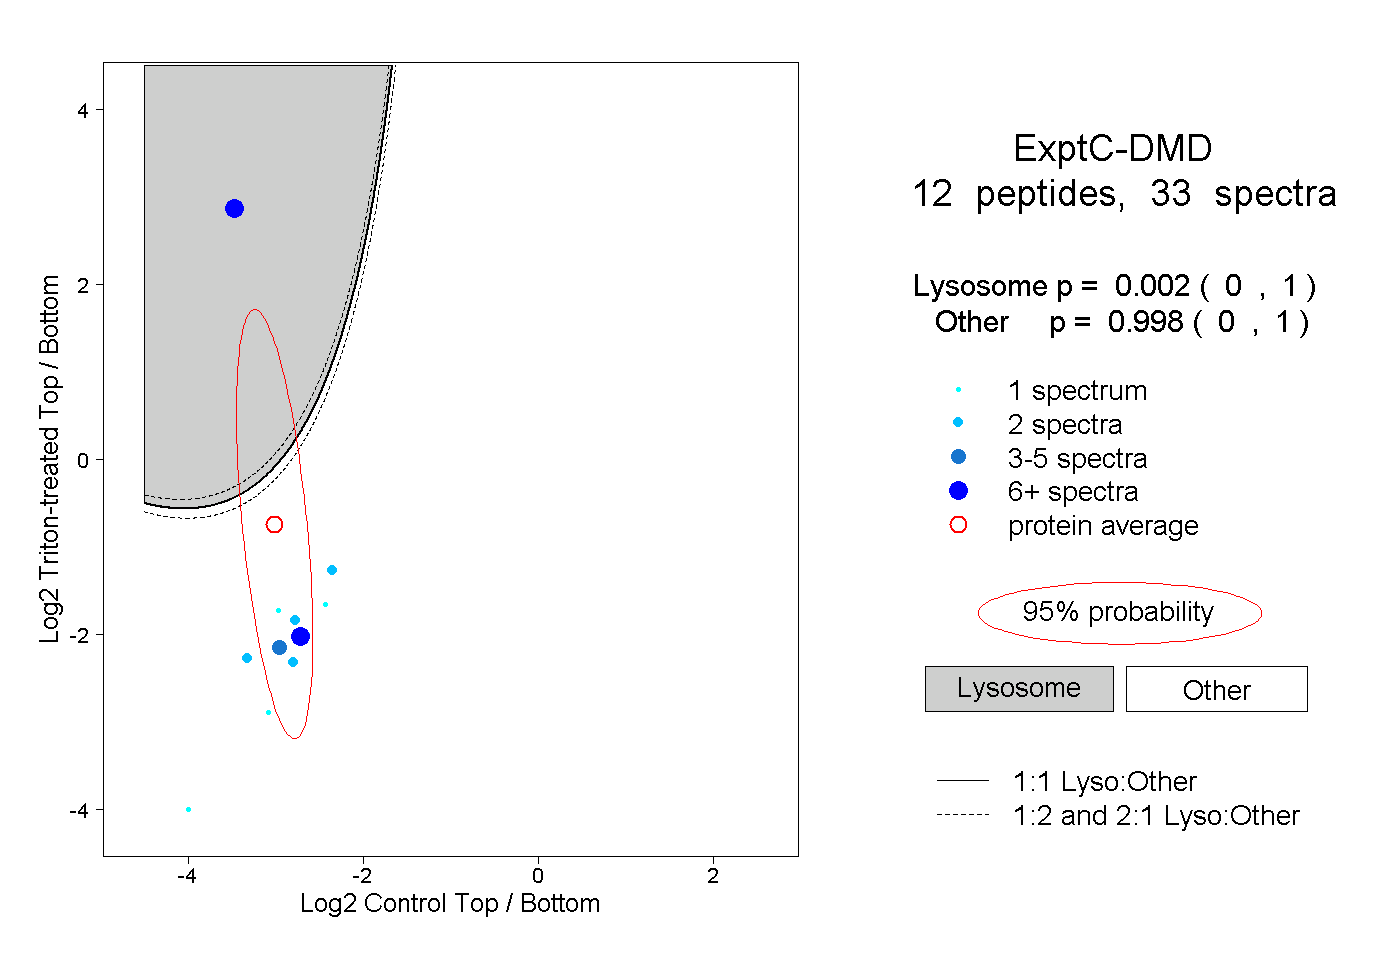
0.000 | 1.000
0.000 | 1.000
3peptides
spectra
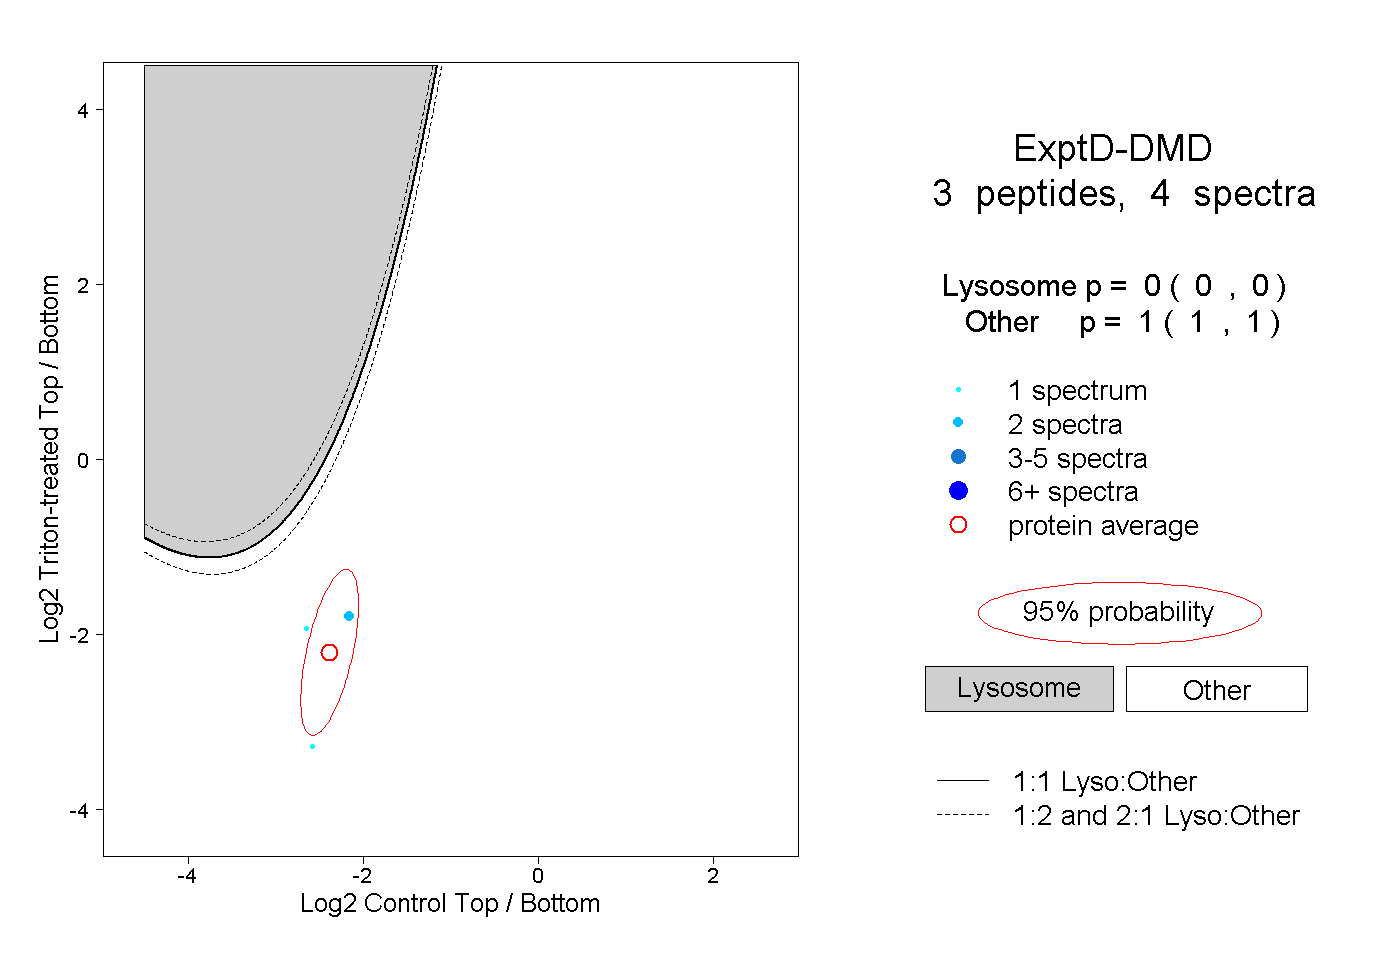
0.000 | 0.000
1.000 | 1.000