 1
1peptide
spectra
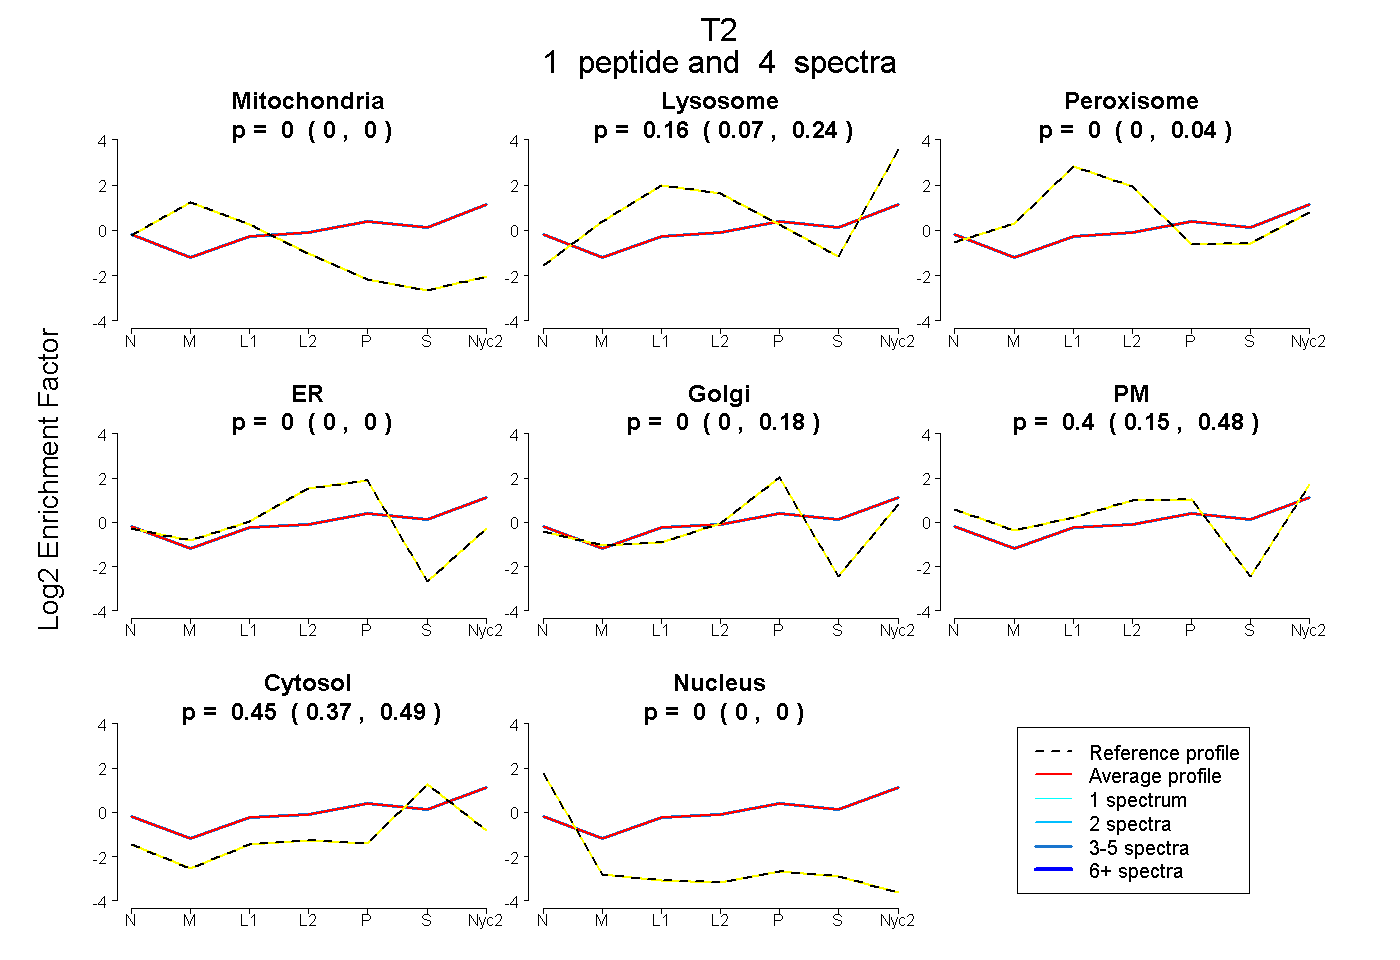
0.000 | 0.000
0.074 | 0.235
0.000 | 0.039
0.000 | 0.000
0.000 | 0.183
0.149 | 0.476
0.372 | 0.495
0.000 | 0.000
2peptides
spectra
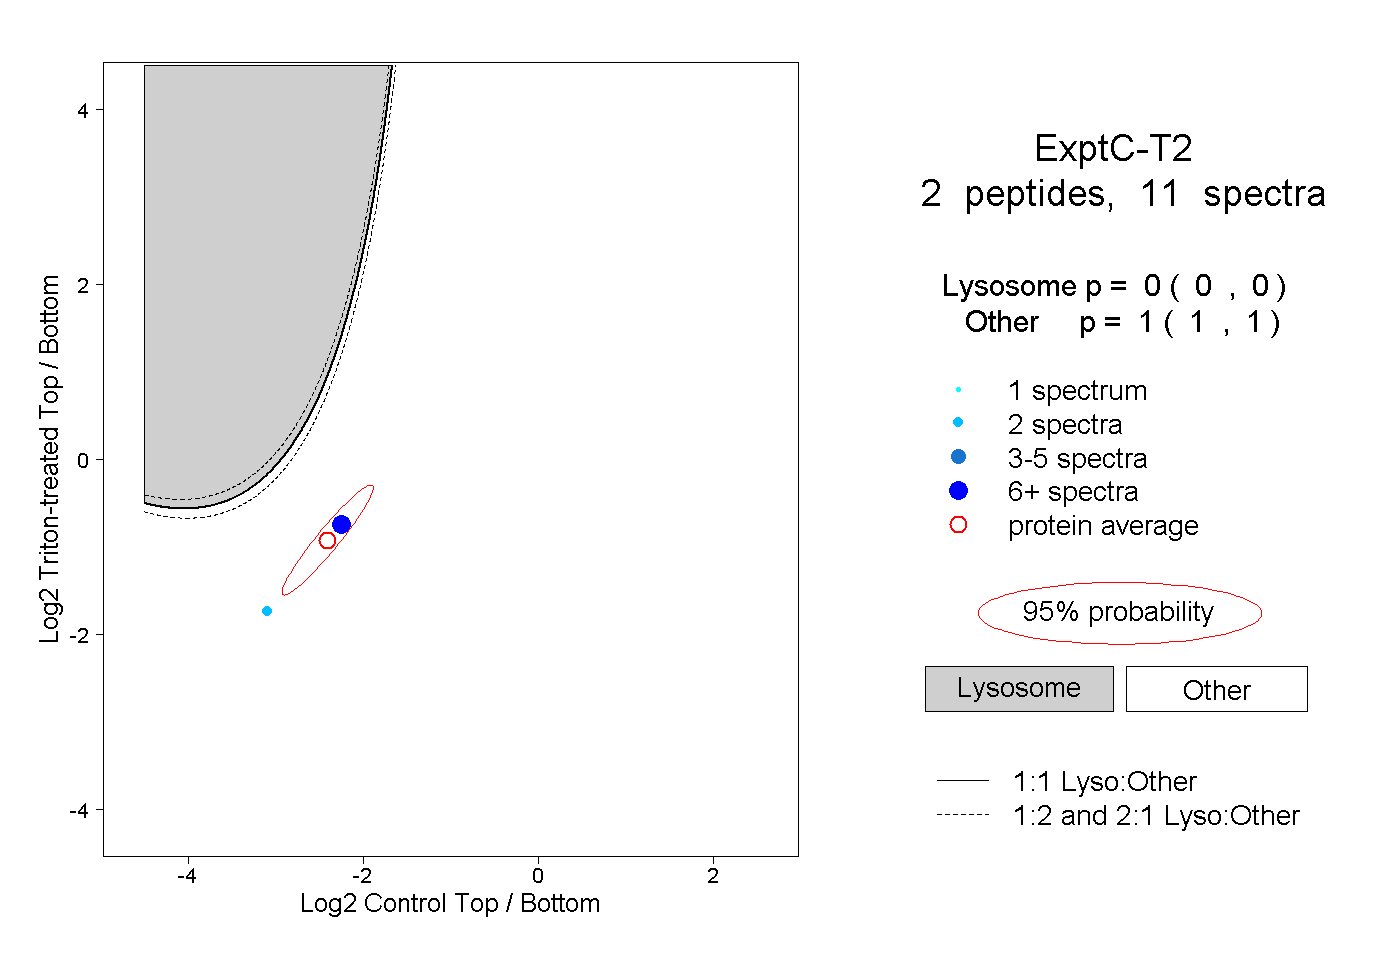
0.000 | 0.000
1.000 | 1.000
1peptide
spectrum
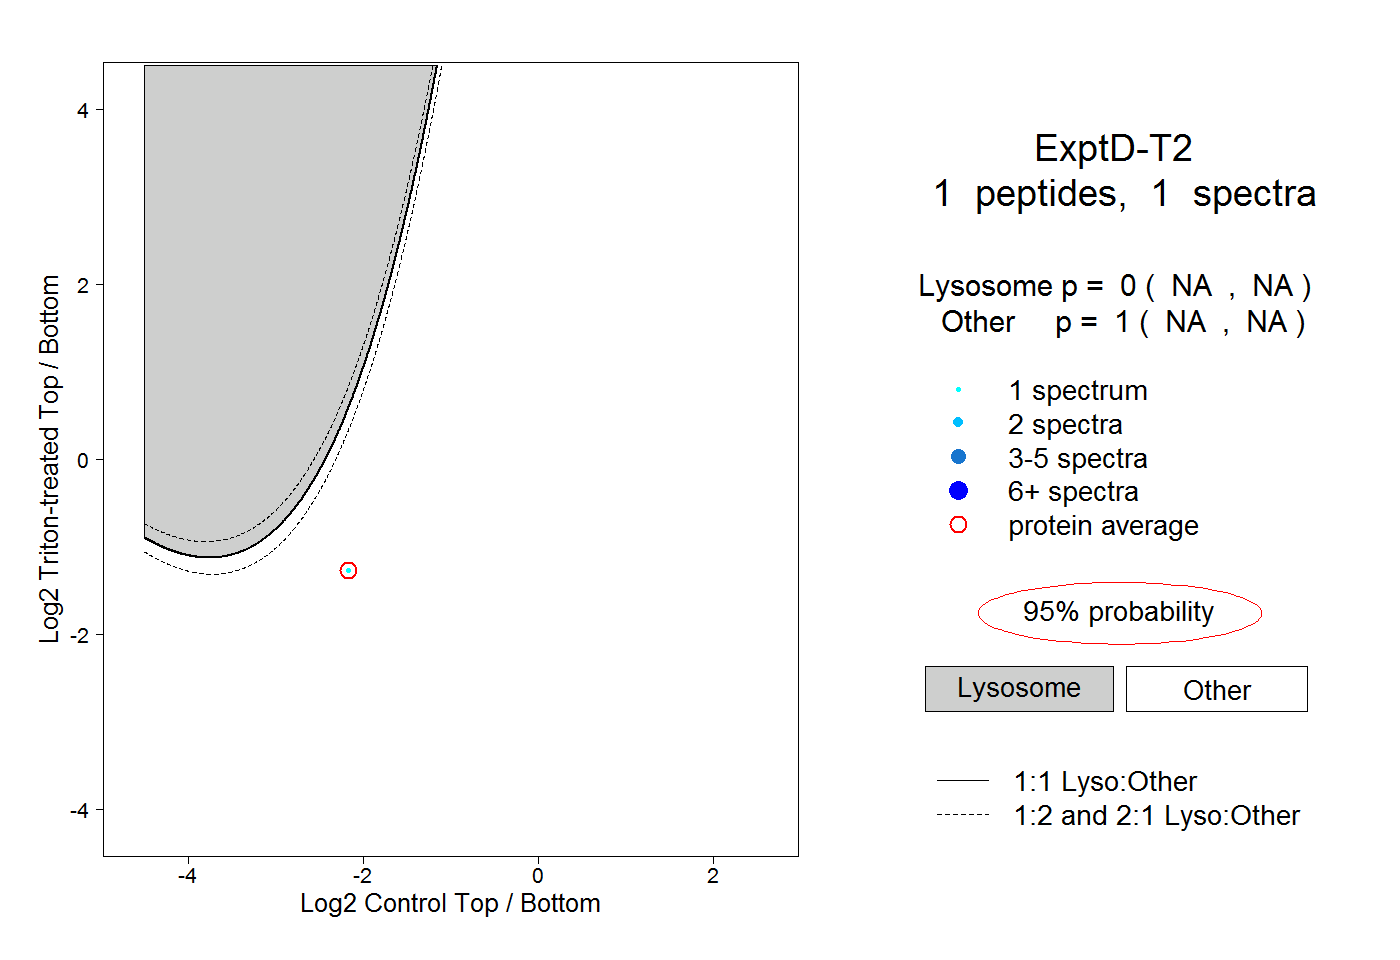
NA | NA
NA | NA