 1
1peptide
spectra
0.000 | 0.000
0.074 | 0.235
0.000 | 0.039
0.000 | 0.000
0.000 | 0.183
0.149 | 0.476
0.372 | 0.495
0.000 | 0.000
| Plot | Mito | Lyso | Perox | ER | Golgi | PM | Cytosol | Nucleus | |||||
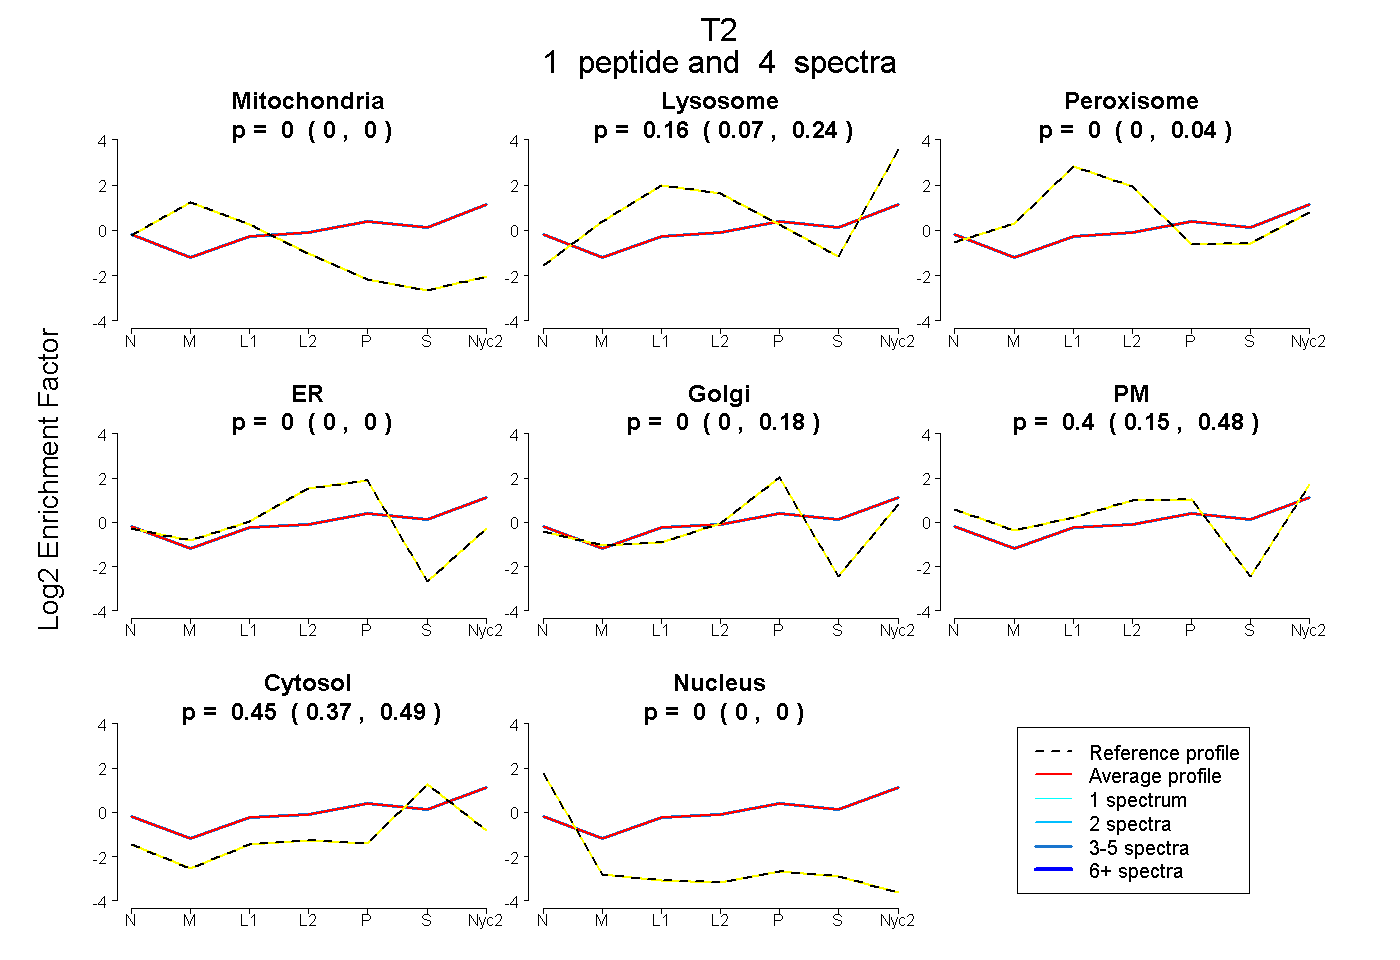
| Expt A |
1 peptide |
4 spectra |
|
0.000 0.000 | 0.000 |
0.156 0.074 | 0.235 |
0.000 0.000 | 0.039 |
0.000 0.000 | 0.000 |
0.000 0.000 | 0.183 |
0.396 0.149 | 0.476 |
0.448 0.372 | 0.495 |
0.000 0.000 | 0.000 |
| 4 spectra, SQILR | 0.000 | 0.156 | 0.000 | 0.000 | 0.000 | 0.396 | 0.448 | 0.000 |
| Plot | Lyso | Other | |||||||||||
| Expt C |
2 peptides |
11 spectra |
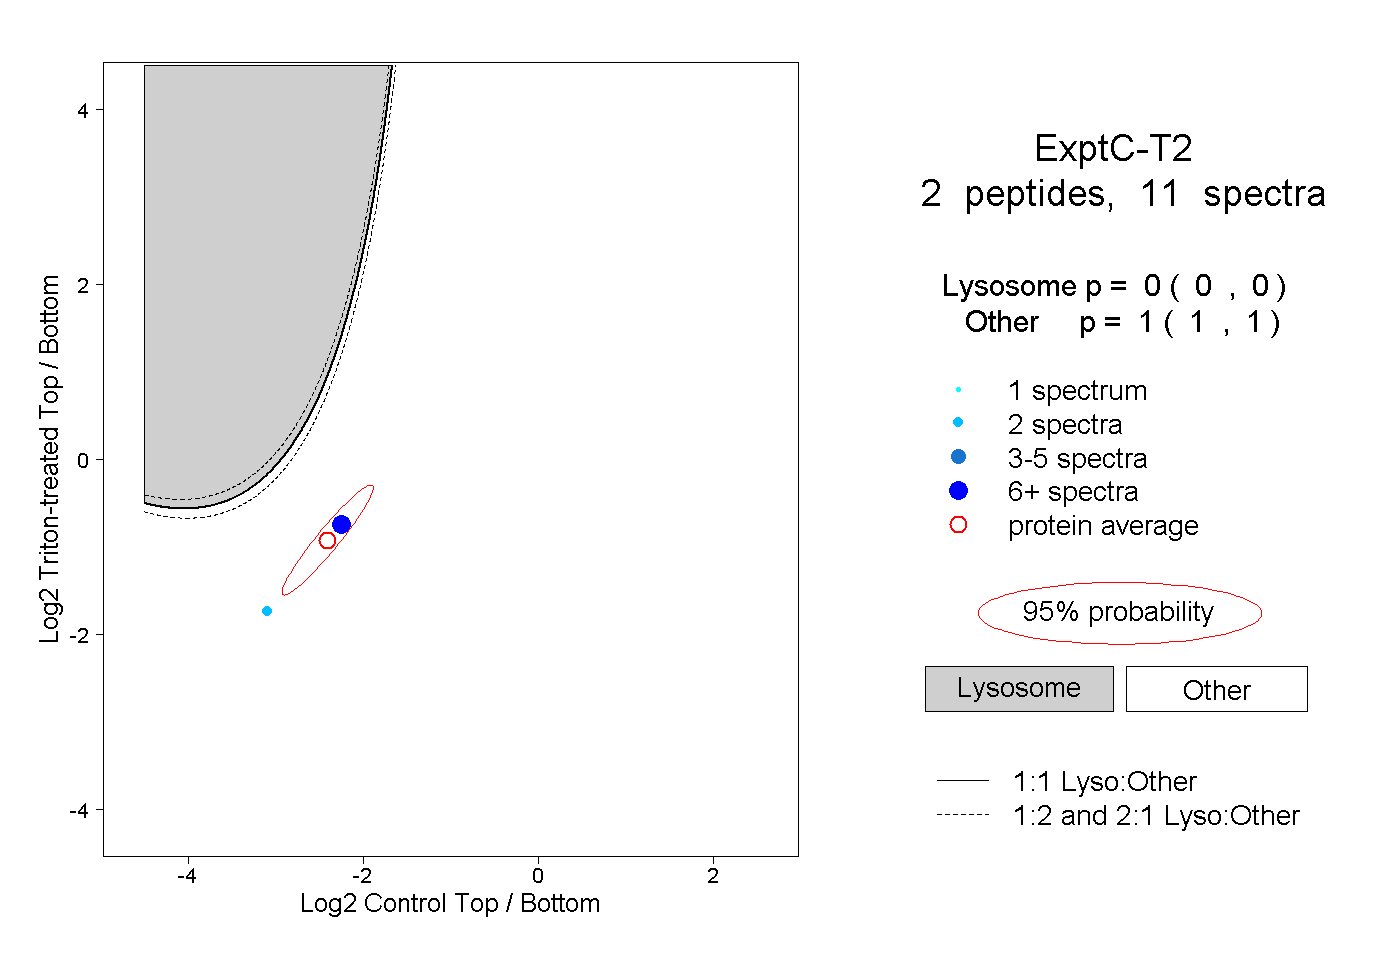 |
0.000 0.000 | 0.000 |
1.000 1.000 | 1.000 |
||||||||
| Plot | Lyso | Other | |||||||||||
| Expt D |
1 peptide |
1 spectrum |
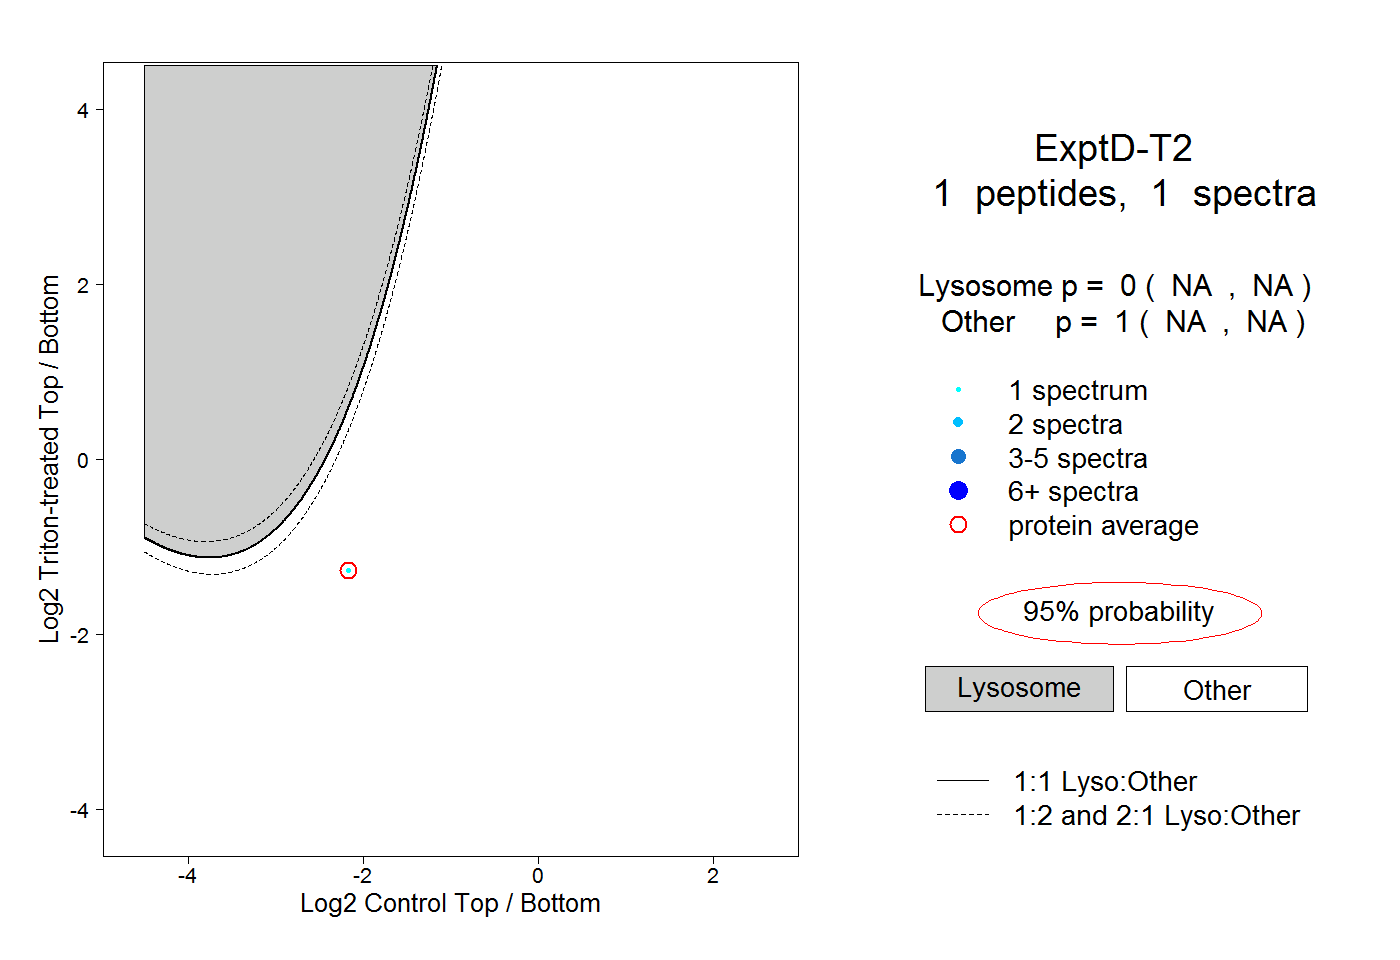 |
0.000 NA | NA |
1.000 NA | NA |