 6
6peptides
spectra
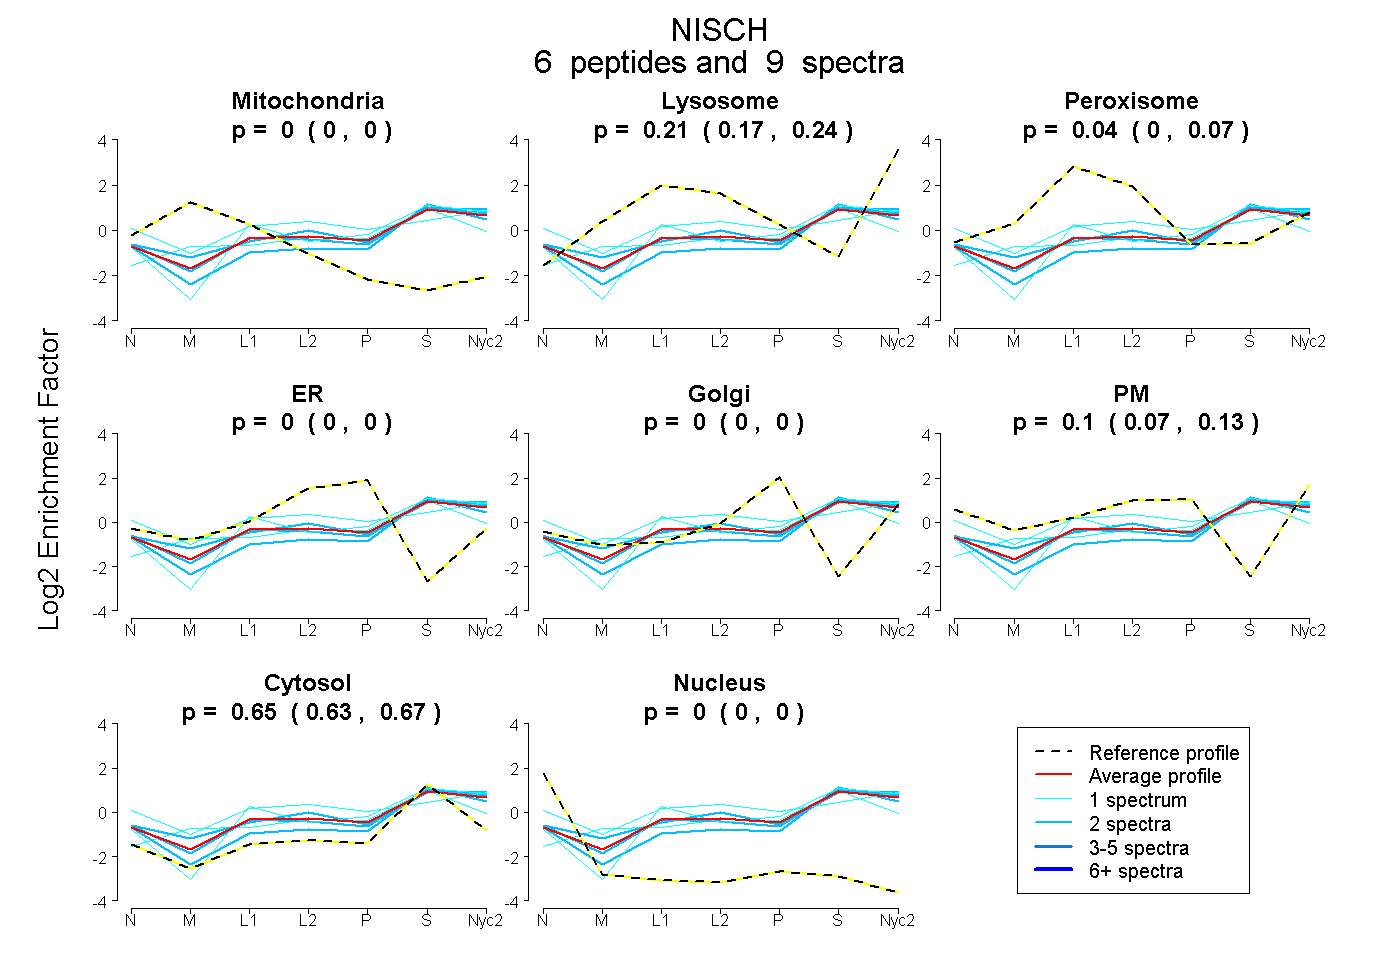
0.000 | 0.000
0.170 | 0.242
0.000 | 0.073
0.000 | 0.000
0.000 | 0.000
0.072 | 0.130
0.628 | 0.669
0.000 | 0.000
6peptides
spectra
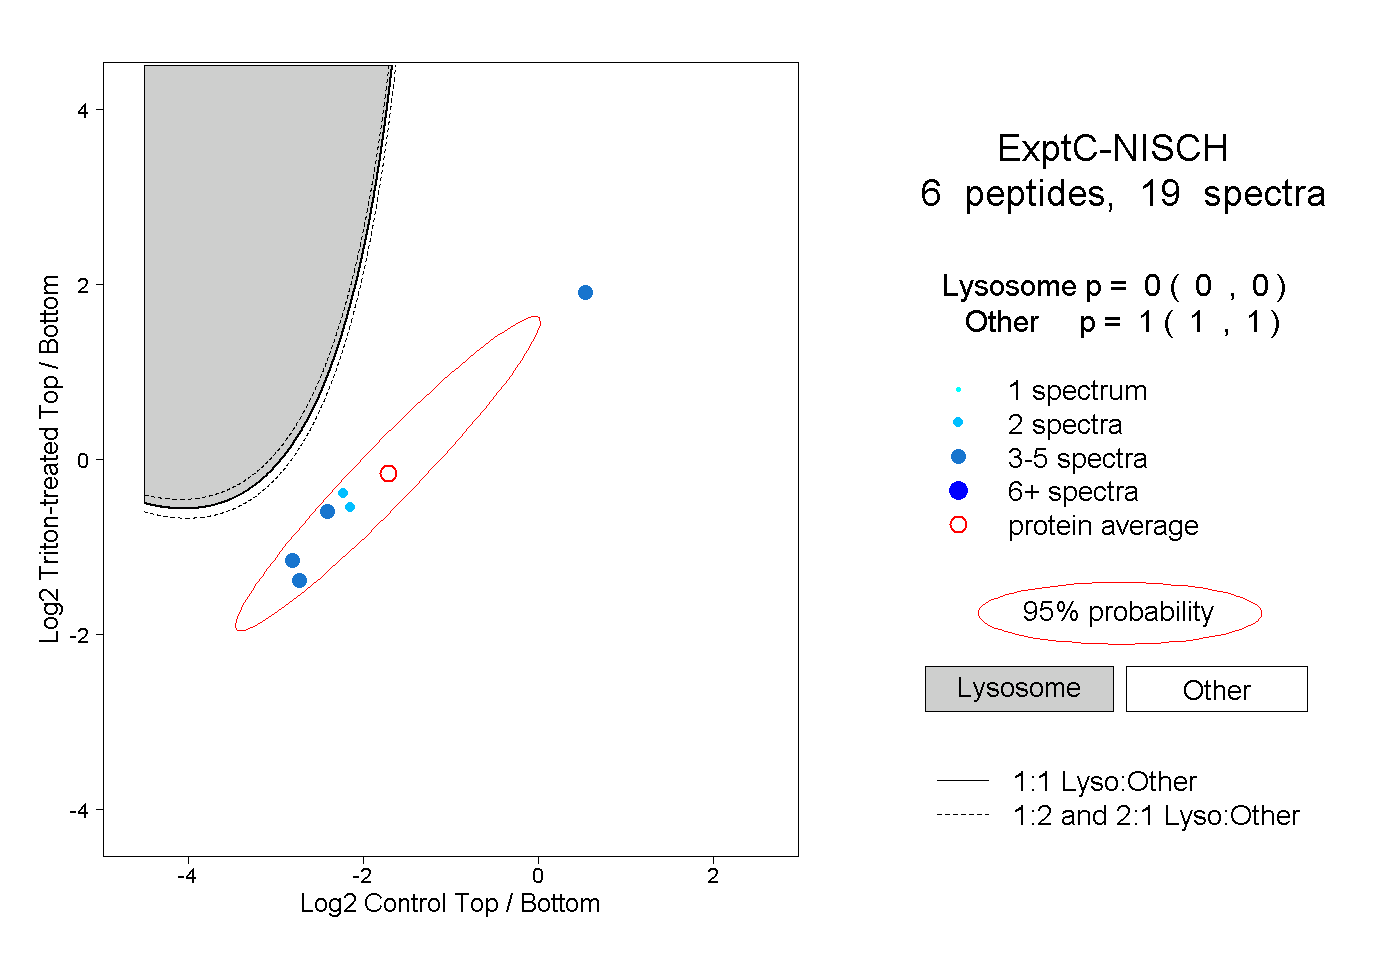
0.000 | 0.000
1.000 | 1.000
1peptide
spectrum
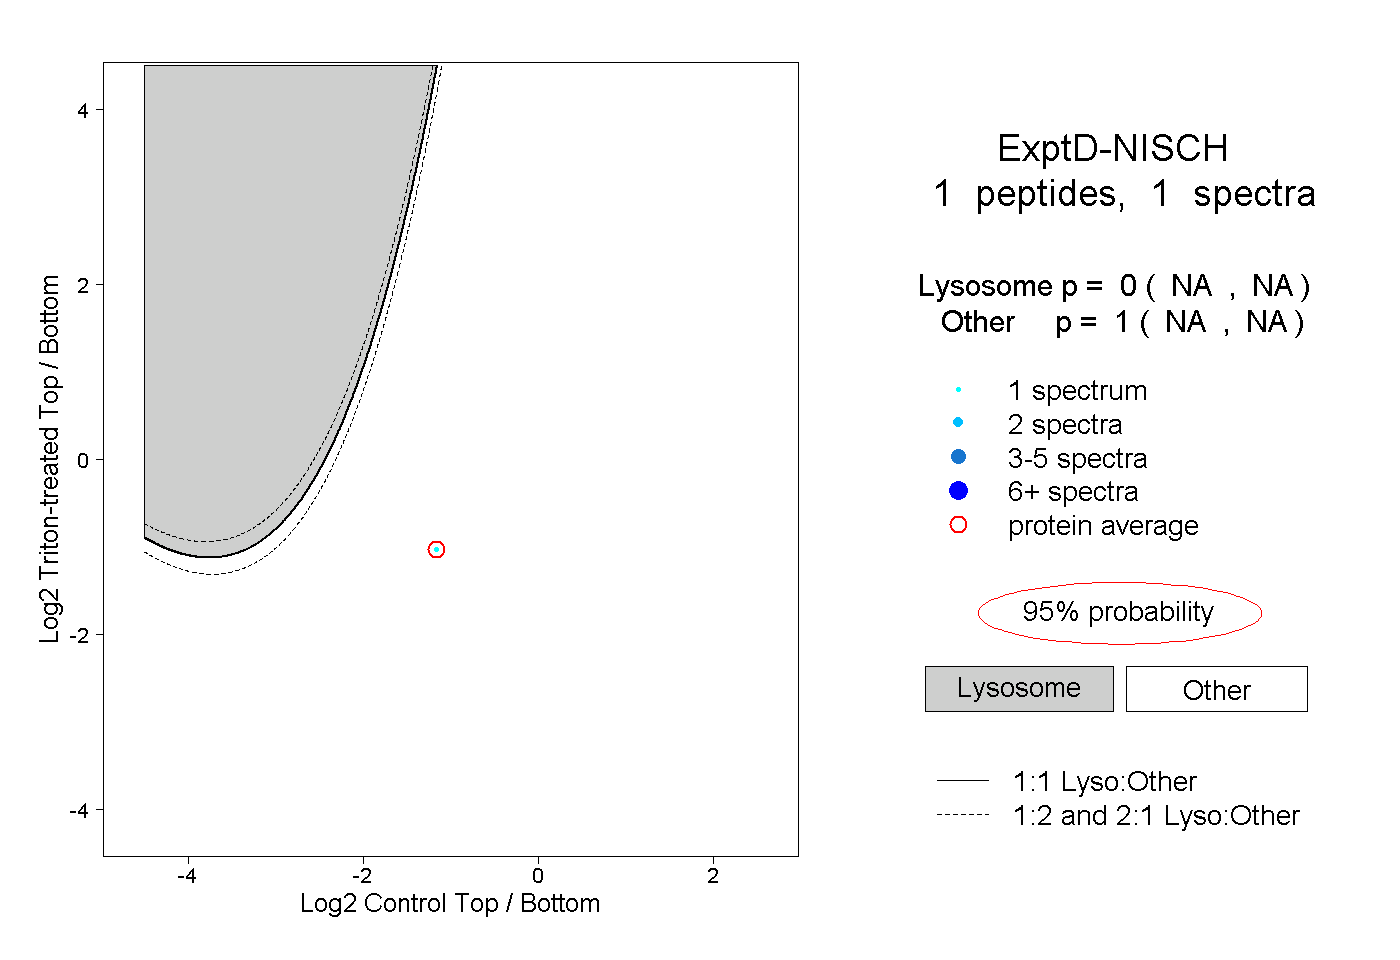
NA | NA
NA | NA