 6
6peptides
spectra
0.000 | 0.000
0.170 | 0.242
0.000 | 0.073
0.000 | 0.000
0.000 | 0.000
0.072 | 0.130
0.628 | 0.669
0.000 | 0.000
| Plot | Mito | Lyso | Perox | ER | Golgi | PM | Cytosol | Nucleus | |||||
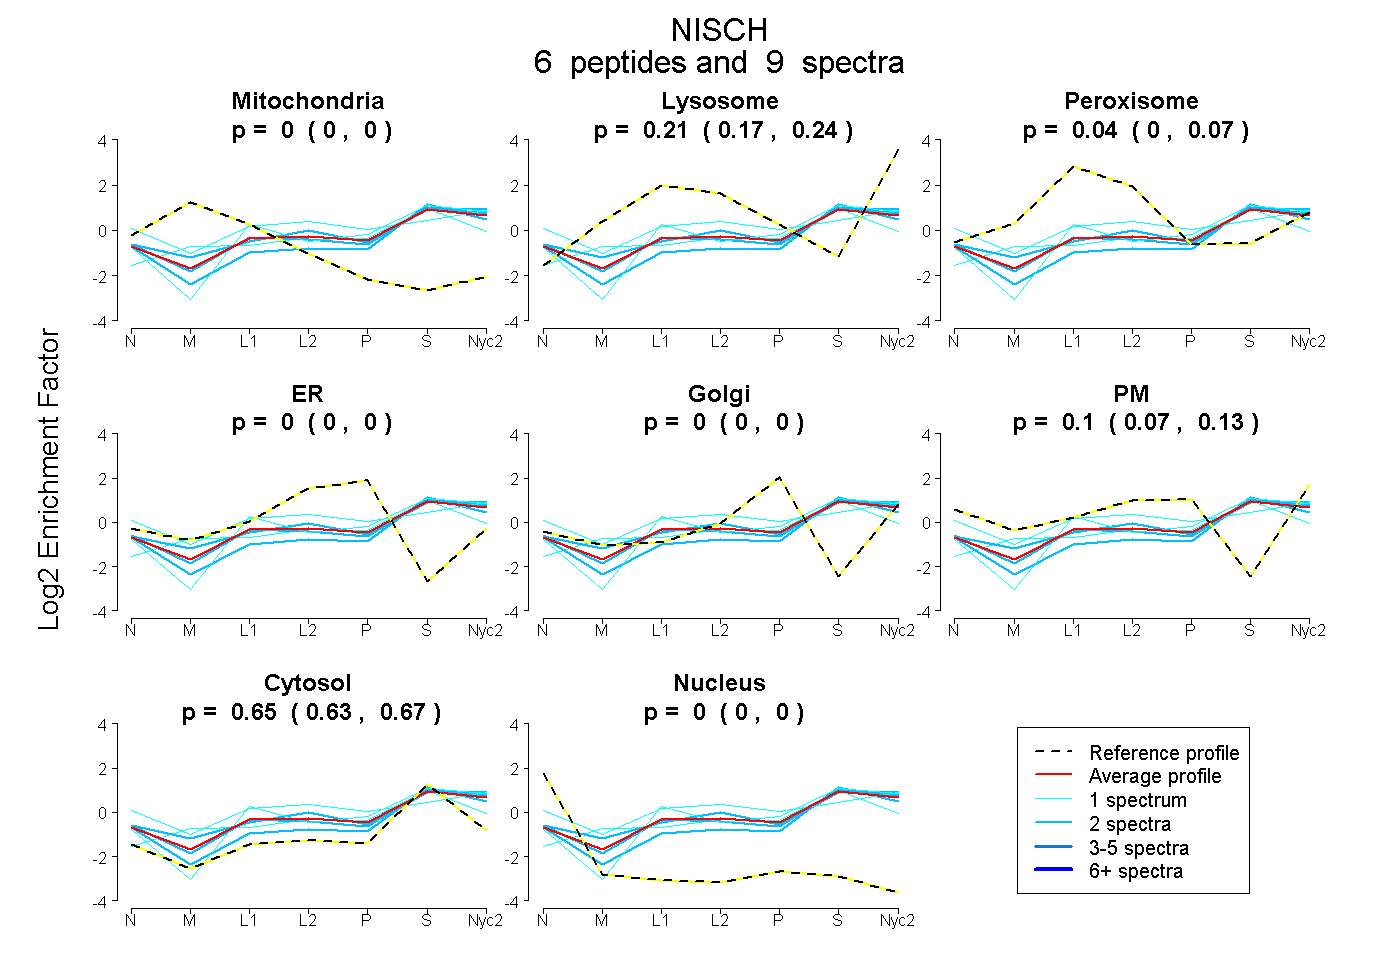
| Expt A |
6 peptides |
9 spectra |
|
0.000 0.000 | 0.000 |
0.209 0.170 | 0.242 |
0.039 0.000 | 0.073 |
0.000 0.000 | 0.000 |
0.000 0.000 | 0.000 |
0.103 0.072 | 0.130 |
0.649 0.628 | 0.669 |
0.000 0.000 | 0.000 |
| 1 spectrum, YSDFHDLHEK | 0.000 | 0.263 | 0.000 | 0.000 | 0.000 | 0.034 | 0.703 | 0.000 | ||
| 1 spectrum, VSGTEGPFGTSNIR | 0.000 | 0.063 | 0.214 | 0.000 | 0.000 | 0.315 | 0.409 | 0.000 | ||
| 2 spectra, IEQLDEVK | 0.000 | 0.227 | 0.023 | 0.000 | 0.000 | 0.078 | 0.672 | 0.000 | ||
| 1 spectrum, ELDTVEVLK | 0.031 | 0.224 | 0.037 | 0.046 | 0.000 | 0.000 | 0.662 | 0.000 | ||
| 2 spectra, TFPDVAPR | 0.000 | 0.113 | 0.000 | 0.000 | 0.000 | 0.093 | 0.794 | 0.000 | ||
| 2 spectra, VLSQFGER | 0.000 | 0.272 | 0.020 | 0.000 | 0.000 | 0.108 | 0.600 | 0.000 |
| Plot | Lyso | Other | |||||||||||
| Expt C |
6 peptides |
19 spectra |
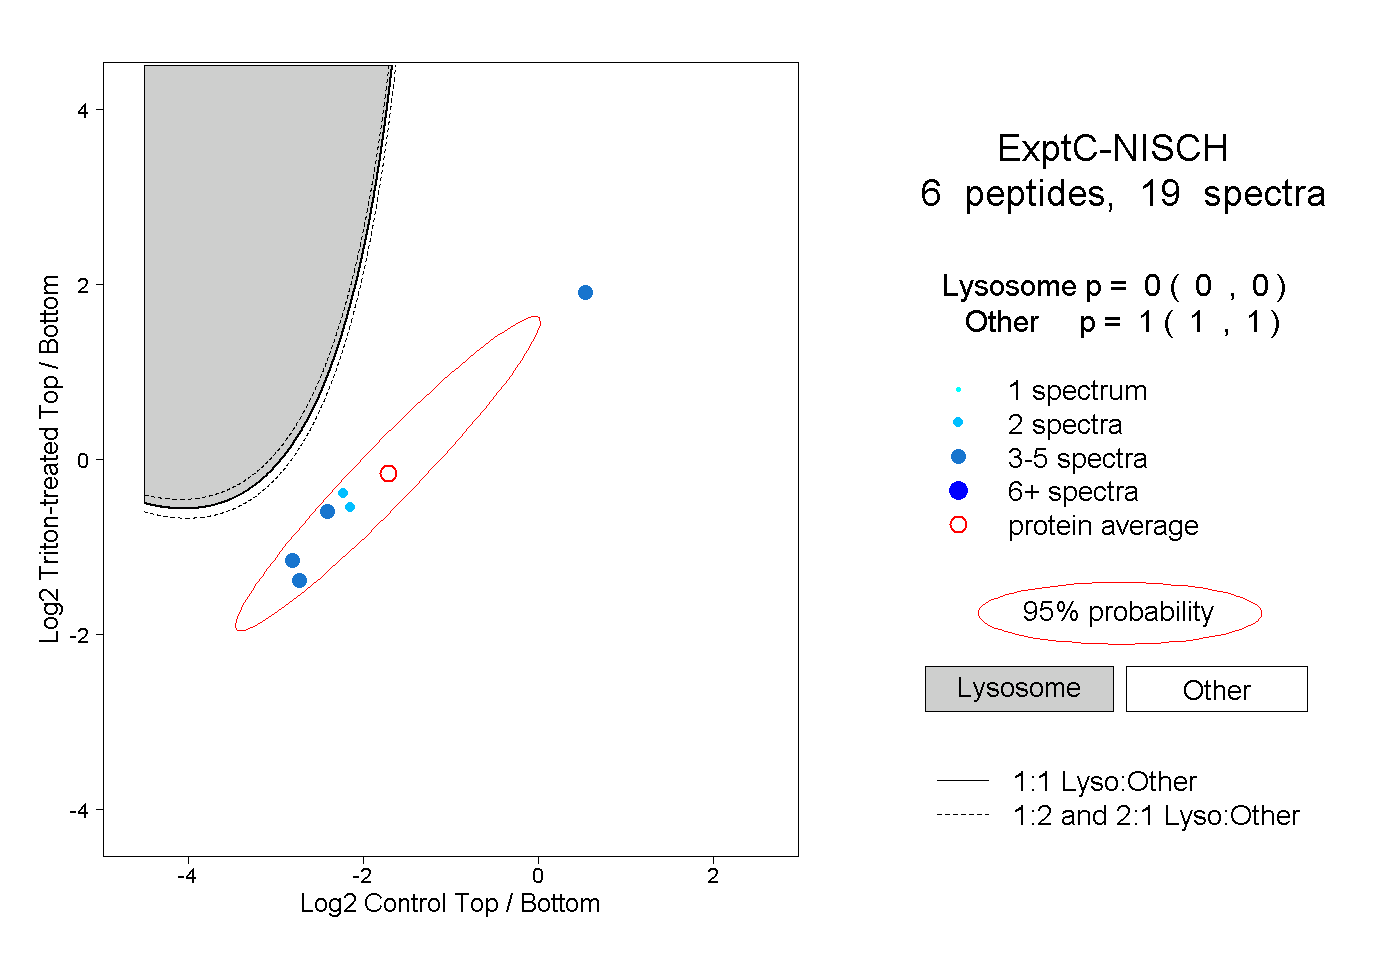 |
0.000 0.000 | 0.000 |
1.000 1.000 | 1.000 |
||||||||
| Plot | Lyso | Other | |||||||||||
| Expt D |
1 peptide |
1 spectrum |
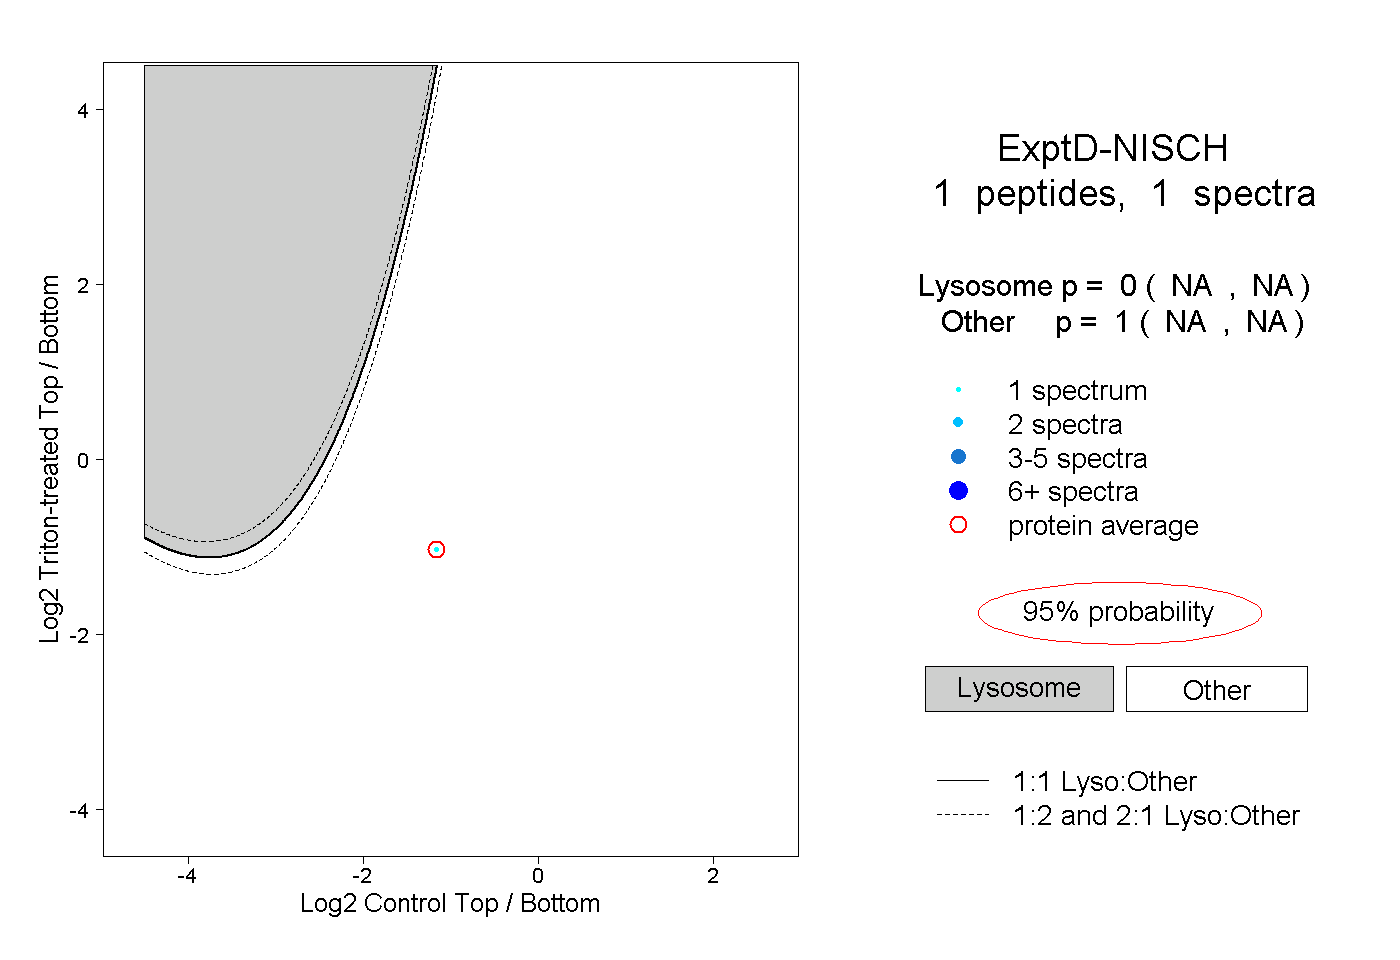 |
0.000 NA | NA |
1.000 NA | NA |