 7
7peptides
spectra
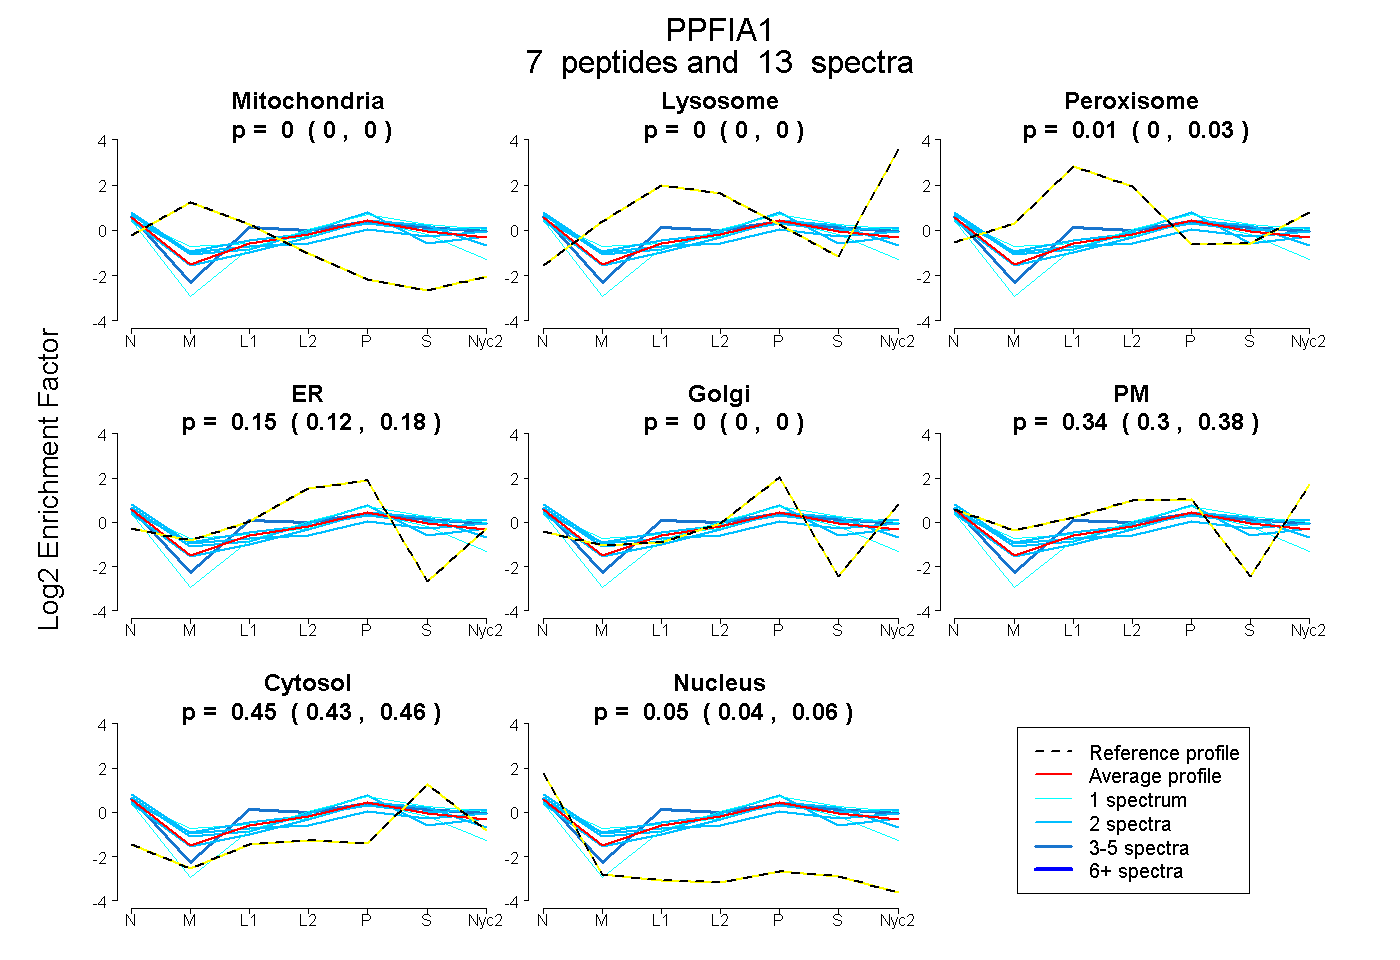
0.000 | 0.000
0.000 | 0.000
0.000 | 0.028
0.116 | 0.176
0.000 | 0.000
0.301 | 0.375
0.431 | 0.464
0.040 | 0.060
3peptides
spectra
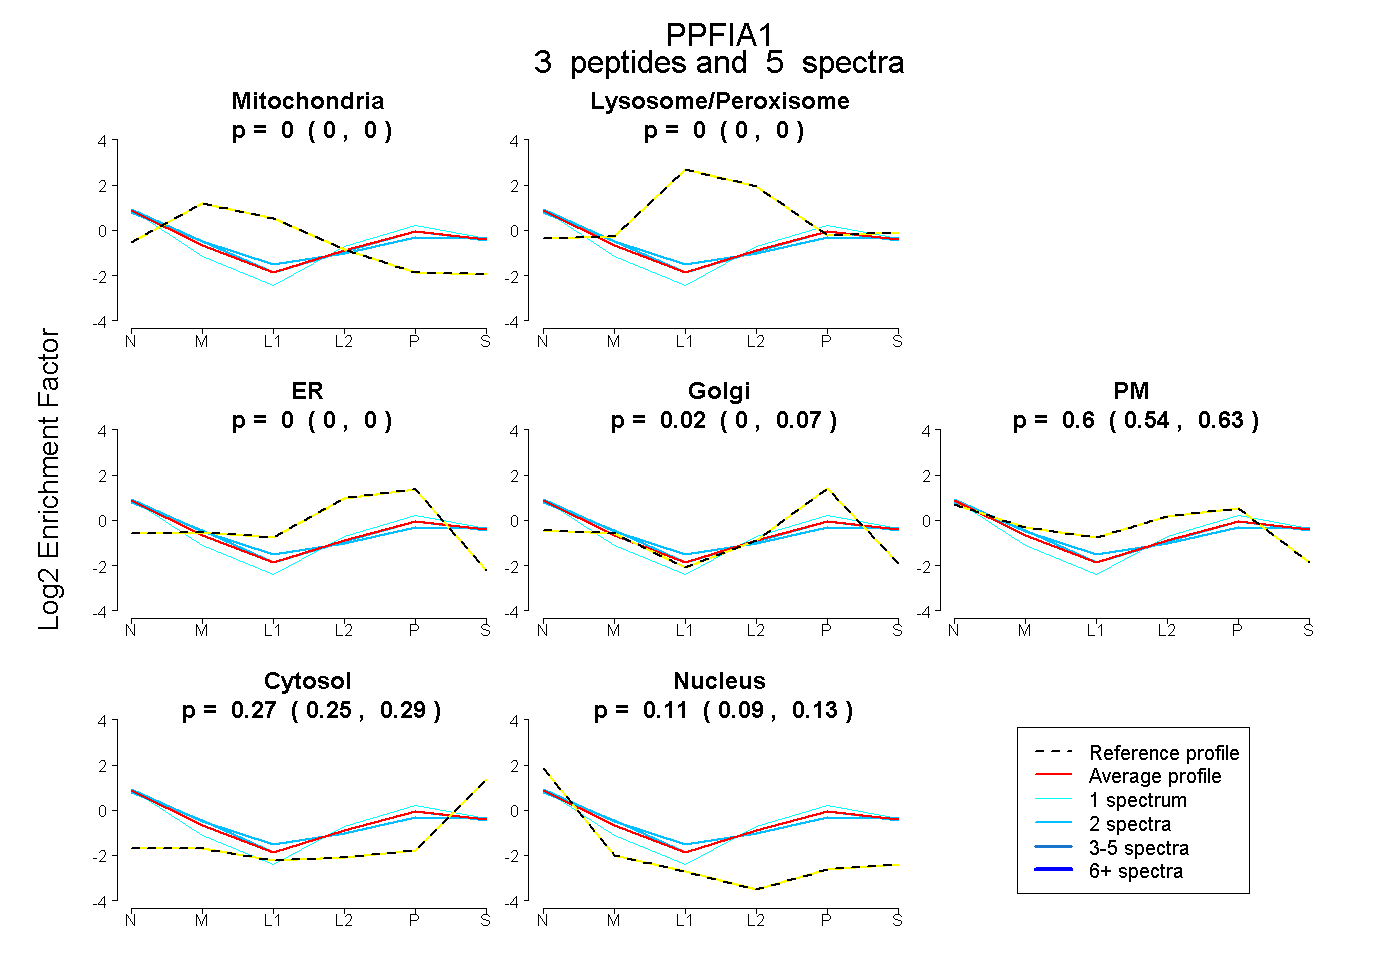
0.000 | 0.000
0.000 | 0.000
0.000 | 0.000
0.000 | 0.073
0.537 | 0.631
0.248 | 0.294
0.086 | 0.127
6peptides
spectra
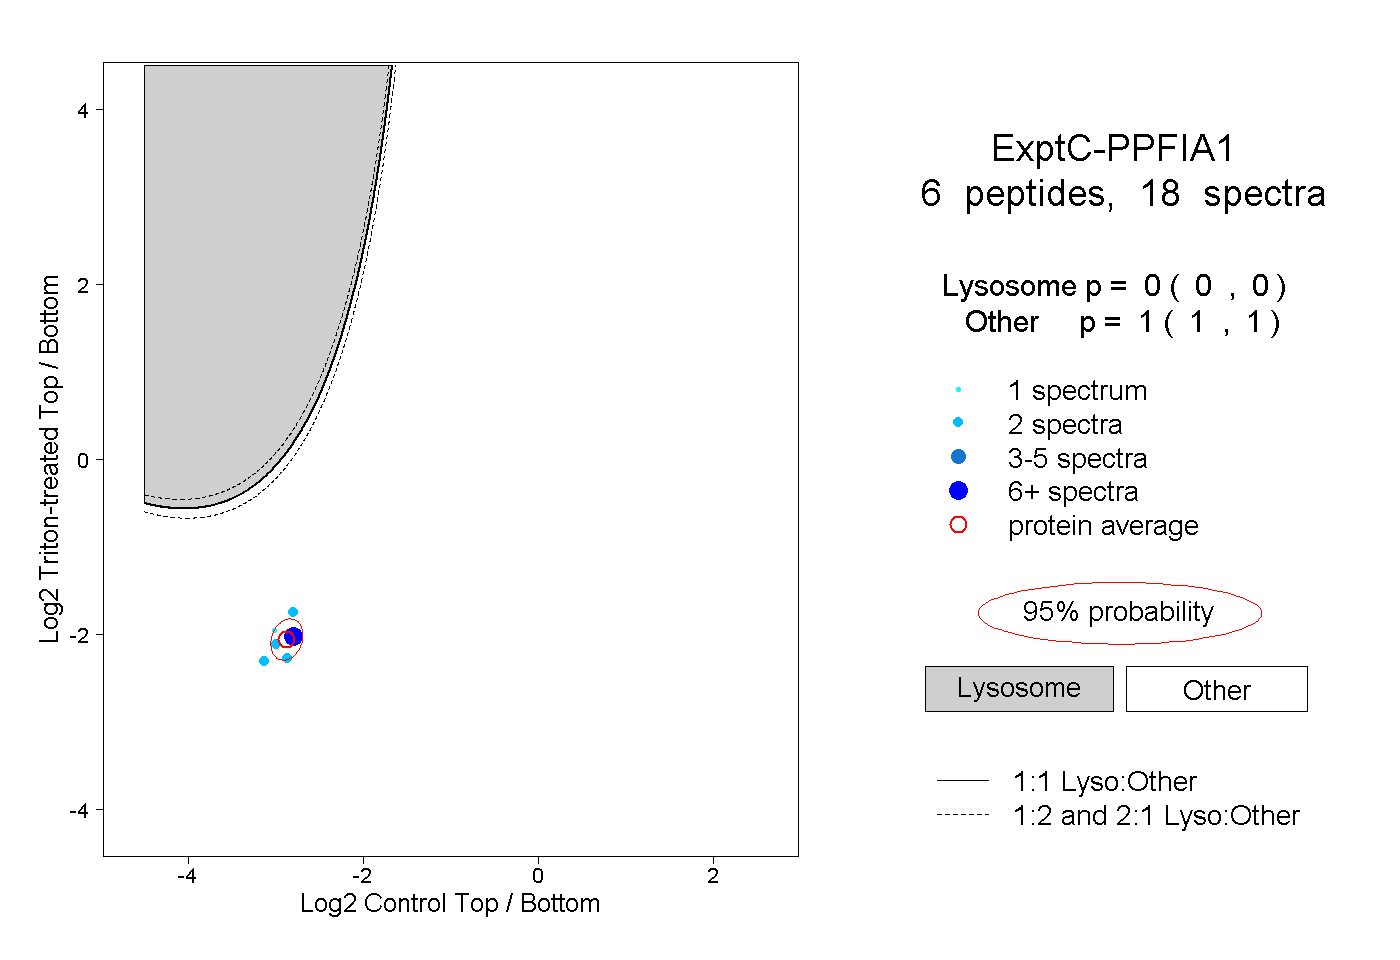
0.000 | 0.000
1.000 | 1.000
2peptides
spectra
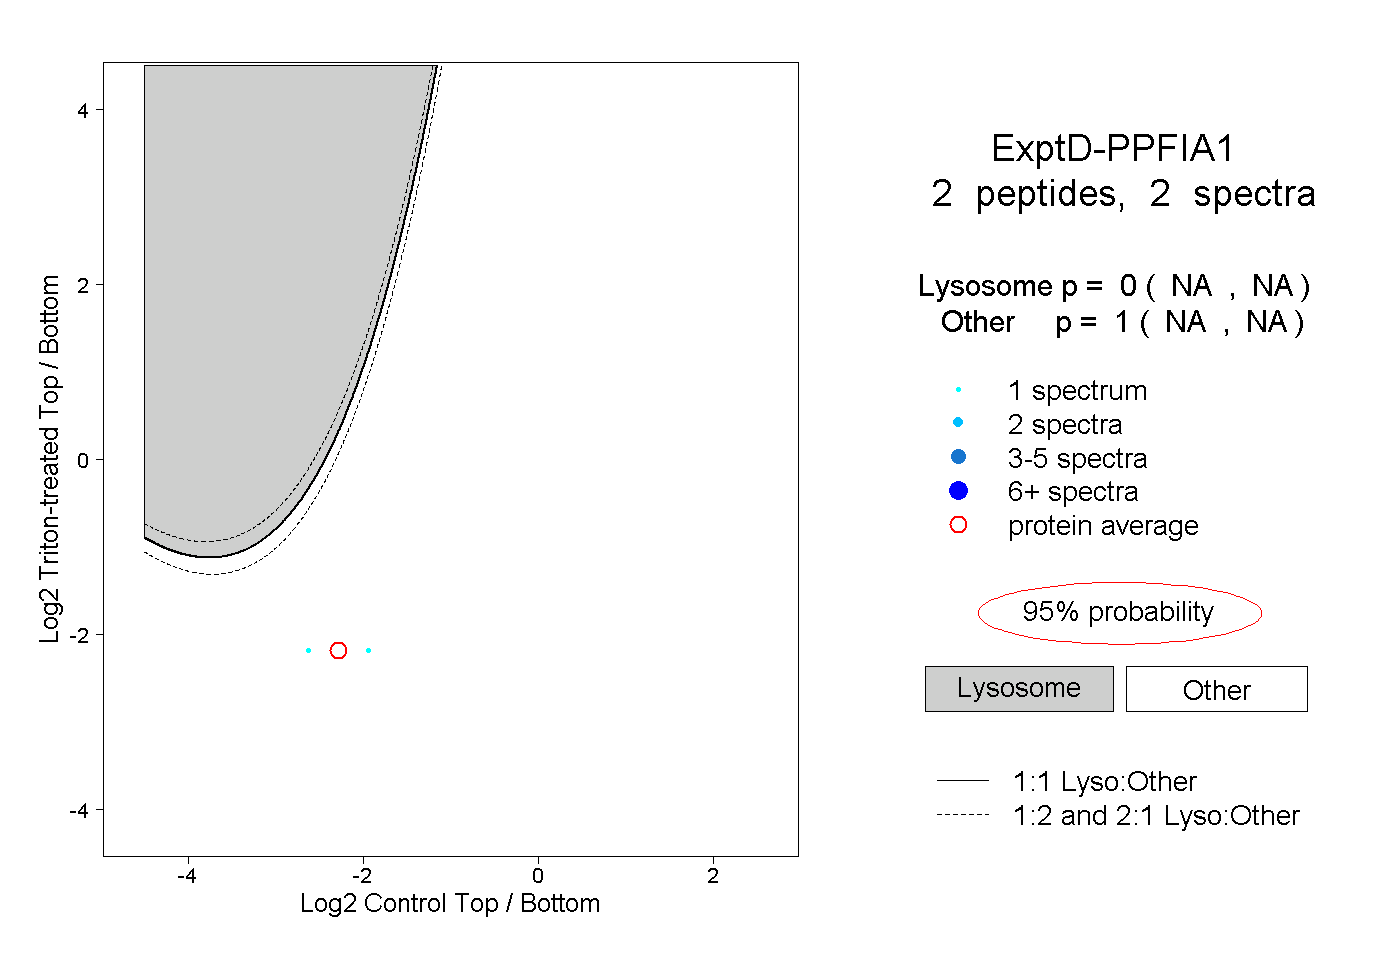
NA | NA
NA | NA