 7
7peptides
spectra
0.000 | 0.000
0.000 | 0.000
0.000 | 0.028
0.116 | 0.176
0.000 | 0.000
0.301 | 0.375
0.431 | 0.464
0.040 | 0.060
| Plot | Mito | Lyso | Perox | ER | Golgi | PM | Cytosol | Nucleus | |||||
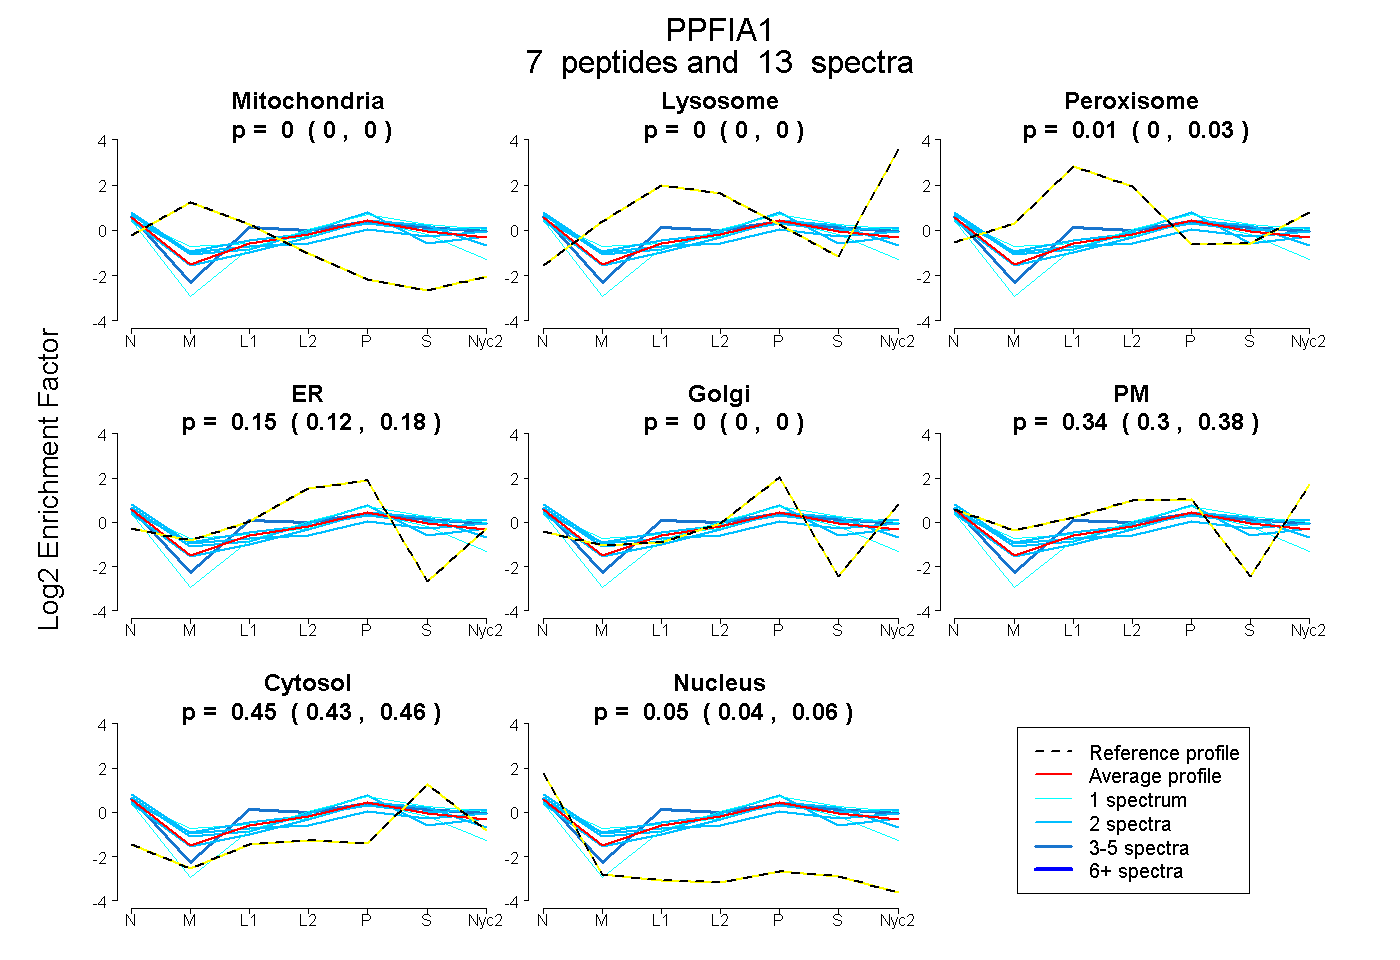
| Expt A |
7 peptides |
13 spectra |
|
0.000 0.000 | 0.000 |
0.000 0.000 | 0.000 |
0.007 0.000 | 0.028 |
0.148 0.116 | 0.176 |
0.000 0.000 | 0.000 |
0.344 0.301 | 0.375 |
0.451 0.431 | 0.464 |
0.050 0.040 | 0.060 |
| 2 spectra, EFNNLLVTGTDR | 0.000 | 0.000 | 0.000 | 0.210 | 0.044 | 0.343 | 0.320 | 0.083 | ||
| 2 spectra, AELEQMR | 0.000 | 0.000 | 0.000 | 0.238 | 0.000 | 0.189 | 0.515 | 0.058 | ||
| 1 spectrum, CSLLEEELGATHK | 0.057 | 0.000 | 0.106 | 0.379 | 0.000 | 0.000 | 0.345 | 0.113 | ||
| 2 spectra, HGNIEER | 0.000 | 0.000 | 0.055 | 0.000 | 0.000 | 0.489 | 0.435 | 0.020 | ||
| 1 spectrum, LGVMTLLPASR | 0.000 | 0.000 | 0.000 | 0.152 | 0.099 | 0.196 | 0.553 | 0.000 | ||
| 3 spectra, AEELESR | 0.000 | 0.000 | 0.079 | 0.111 | 0.000 | 0.317 | 0.481 | 0.011 | ||
| 2 spectra, QMEAQLEEK | 0.000 | 0.000 | 0.027 | 0.000 | 0.000 | 0.476 | 0.383 | 0.113 |
| Plot | Mito | Lyso or Perox | ER | Golgi | PM | Cytosol | Nucleus | ||||||
| Expt B |
3 peptides |
5 spectra |
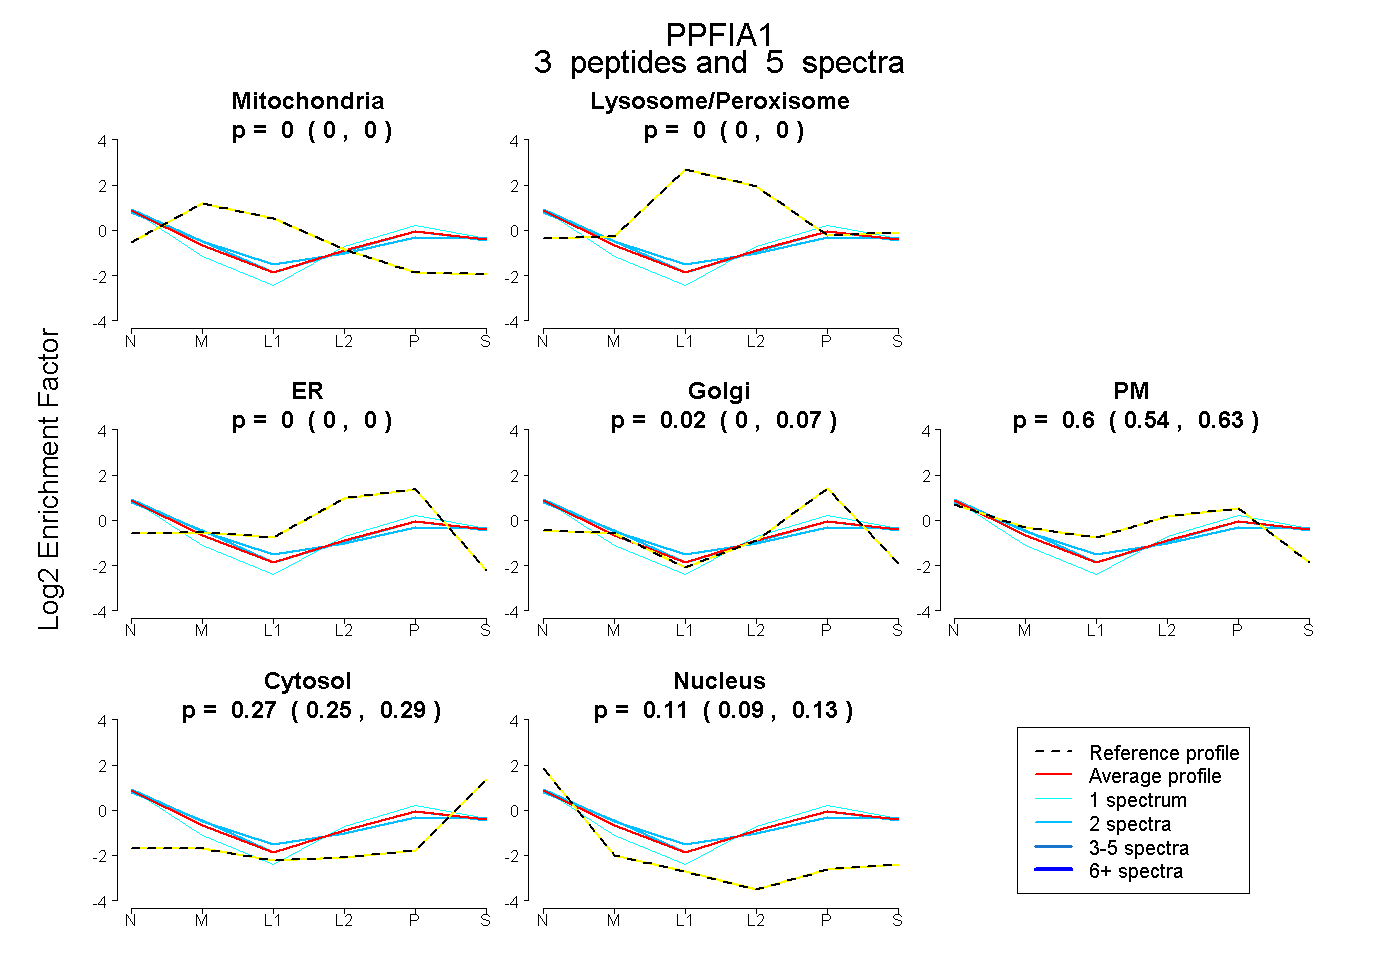 |
0.000 0.000 | 0.000 |
0.000 0.000 | 0.000 |
0.000 0.000 | 0.000 |
0.017 0.000 | 0.073 |
0.603 0.537 | 0.631 |
0.274 0.248 | 0.294 |
0.106 0.086 | 0.127 |
|||
| Plot | Lyso | Other | |||||||||||
| Expt C |
6 peptides |
18 spectra |
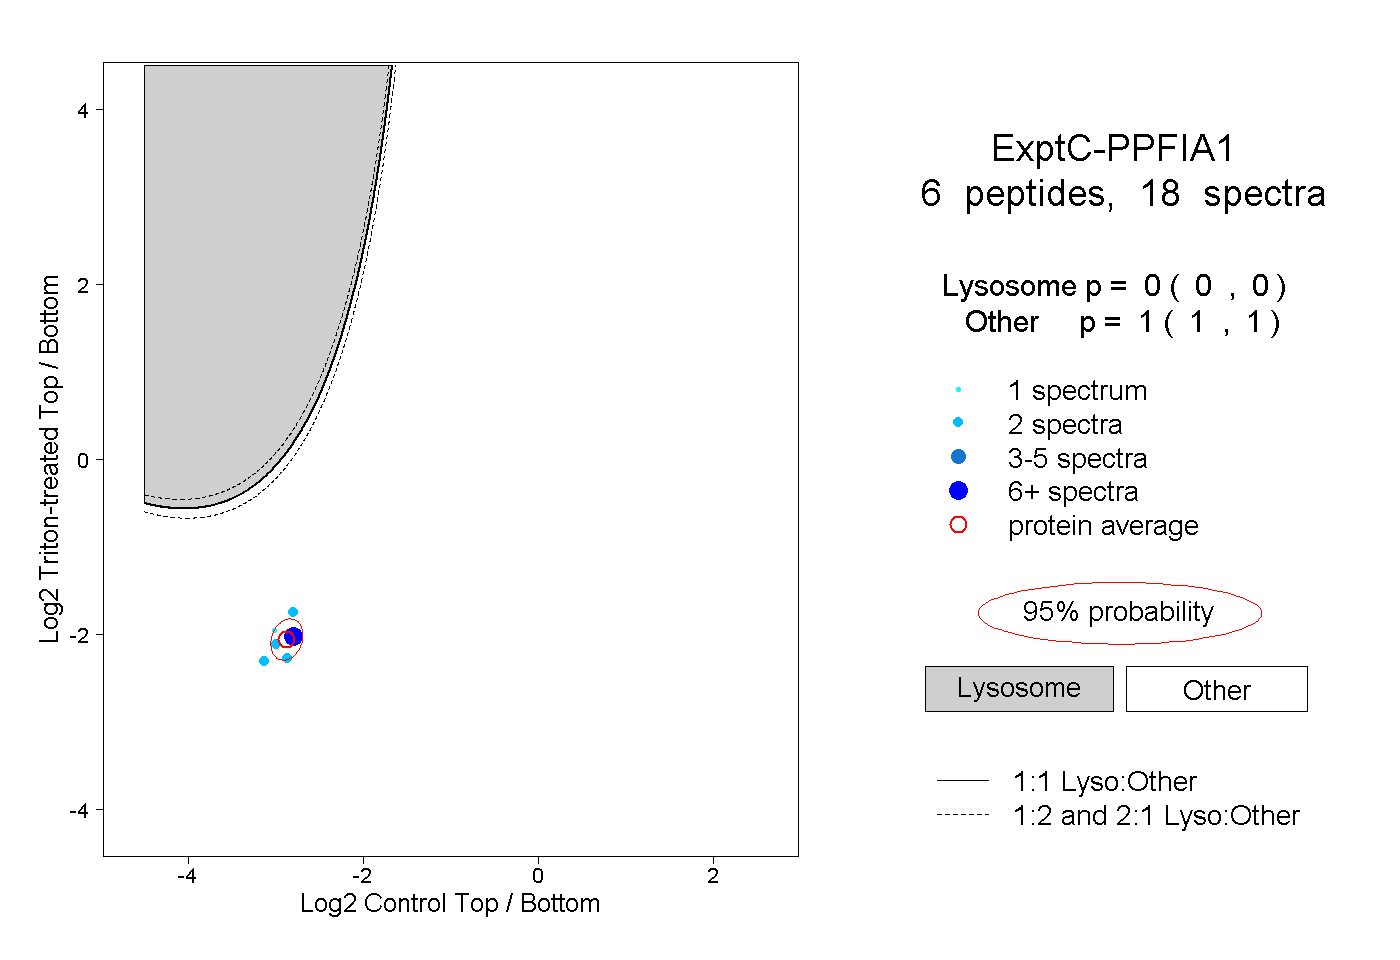 |
0.000 0.000 | 0.000 |
1.000 1.000 | 1.000 |
||||||||
| Plot | Lyso | Other | |||||||||||
| Expt D |
2 peptides |
2 spectra |
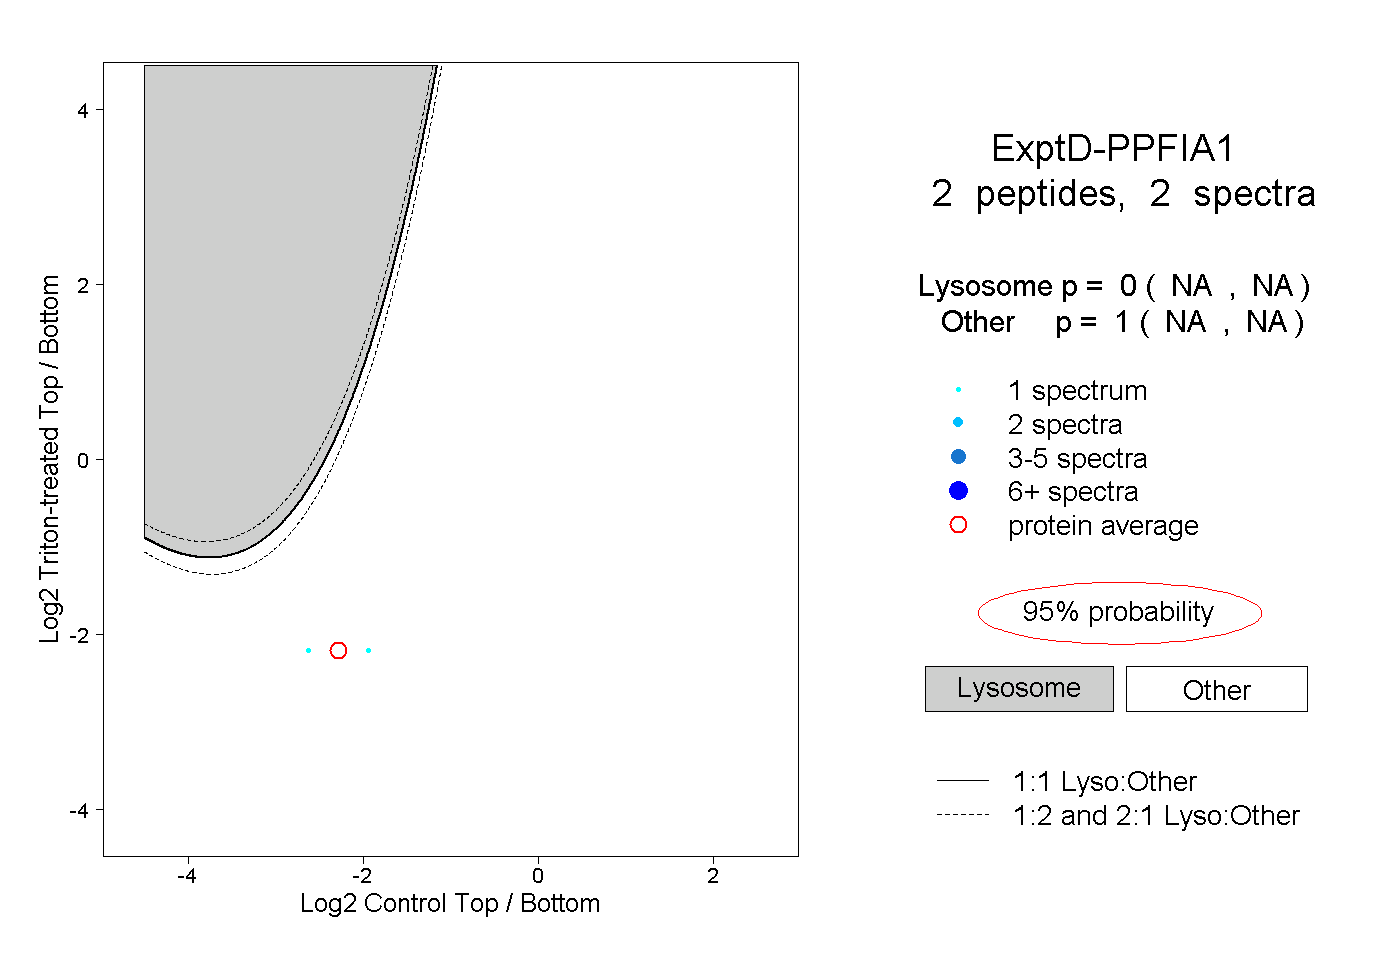 |
0.000 NA | NA |
1.000 NA | NA |