 10
10peptides
spectra
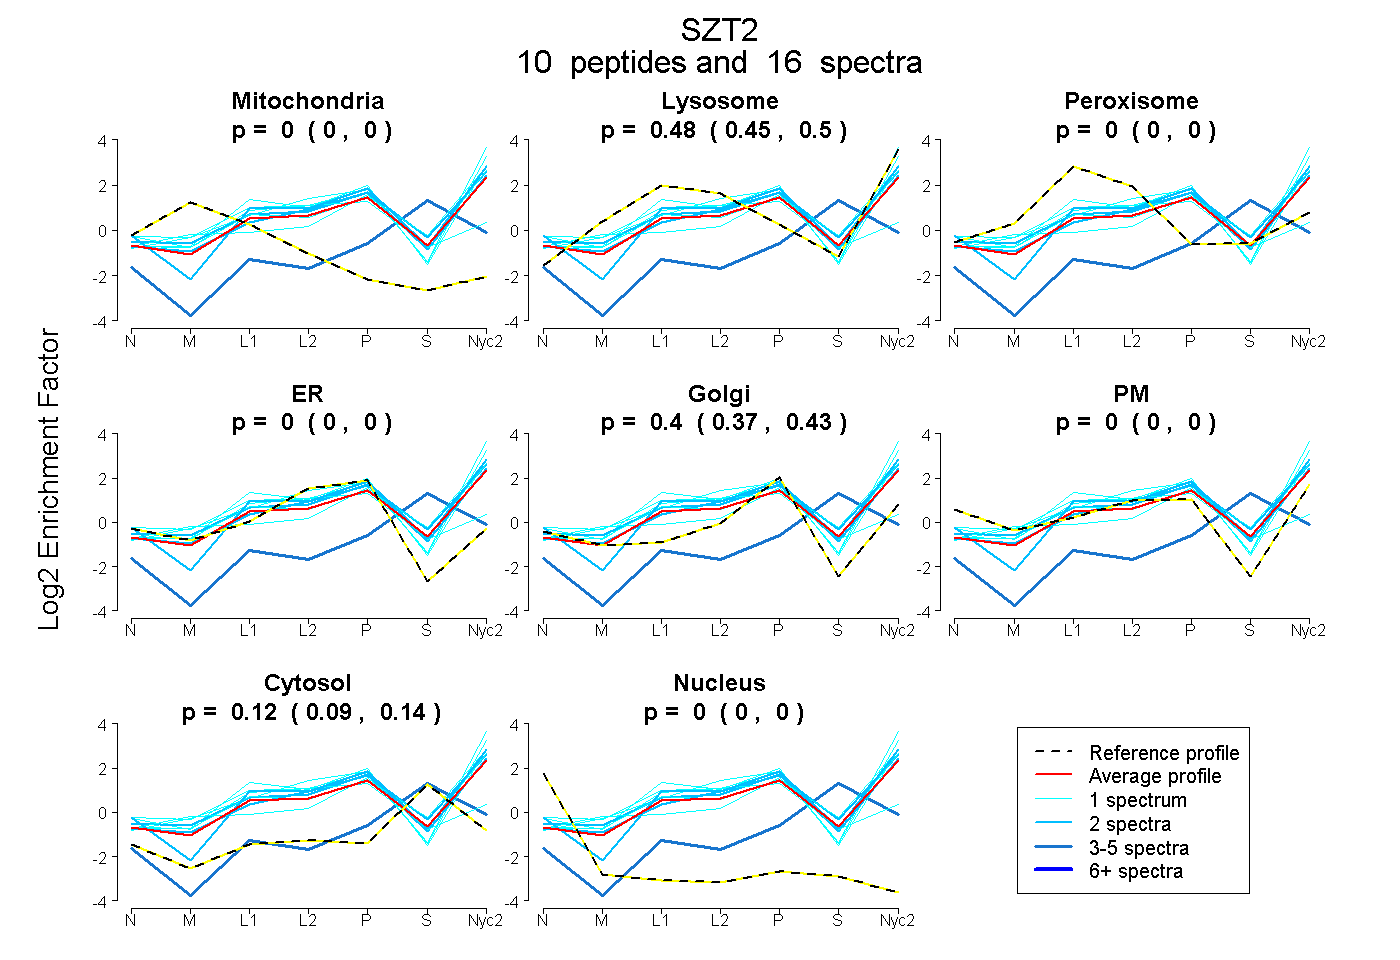
0.000 | 0.000
0.451 | 0.502
0.000 | 0.000
0.000 | 0.000
0.373 | 0.429
0.000 | 0.000
0.094 | 0.137
0.000 | 0.000
5peptides
spectra
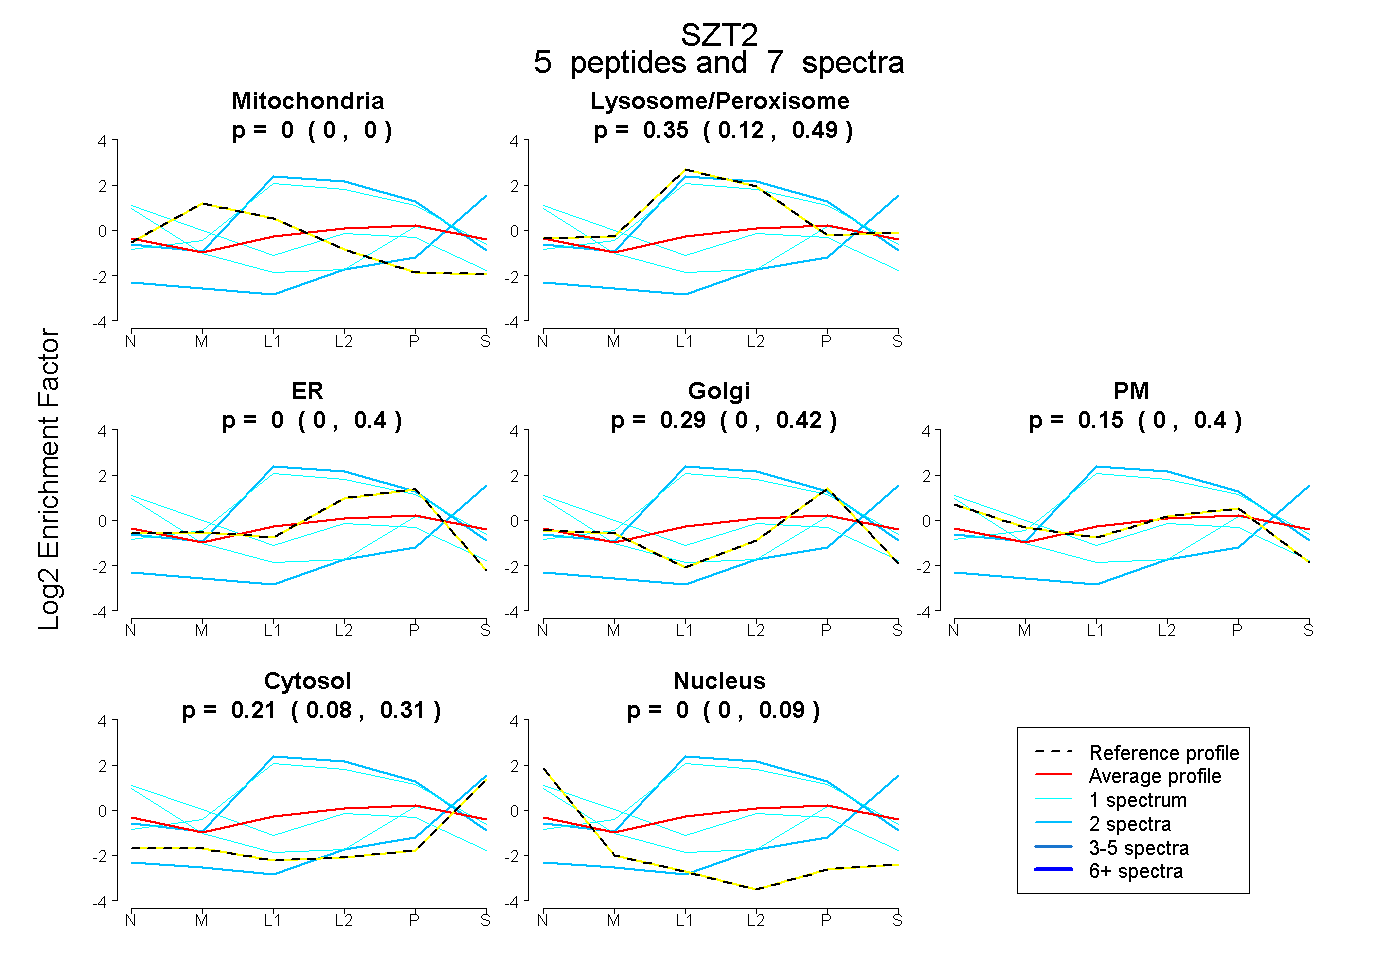
0.000 | 0.000
0.123 | 0.492
0.000 | 0.397
0.000 | 0.416
0.000 | 0.400
0.084 | 0.314
0.000 | 0.090
29peptides
spectra
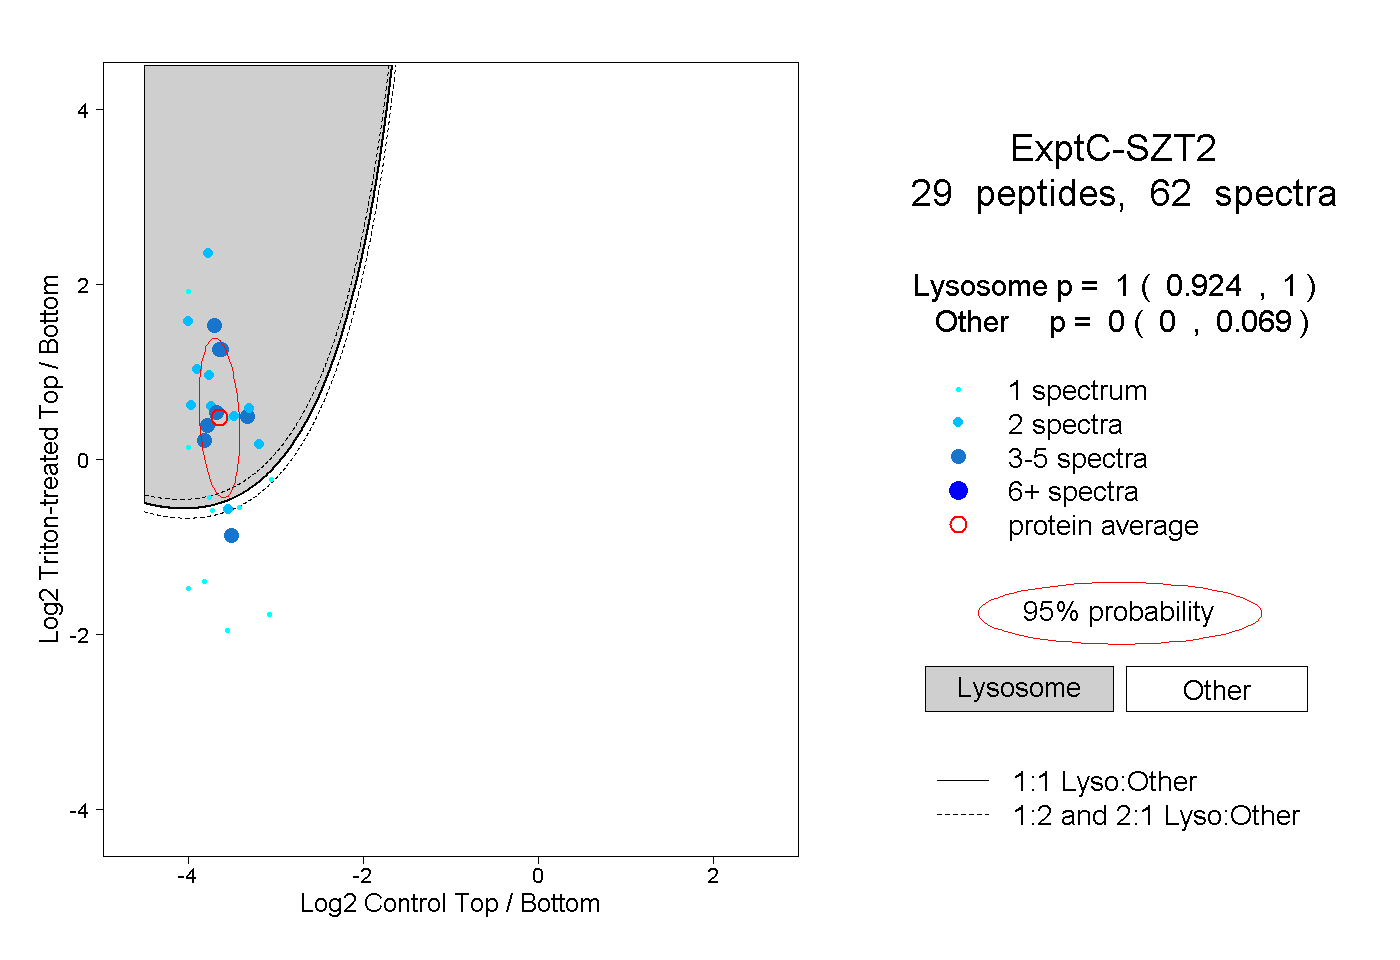
0.924 | 1.000
0.000 | 0.069