 10
10peptides
spectra
0.000 | 0.000
0.451 | 0.502
0.000 | 0.000
0.000 | 0.000
0.373 | 0.429
0.000 | 0.000
0.094 | 0.137
0.000 | 0.000
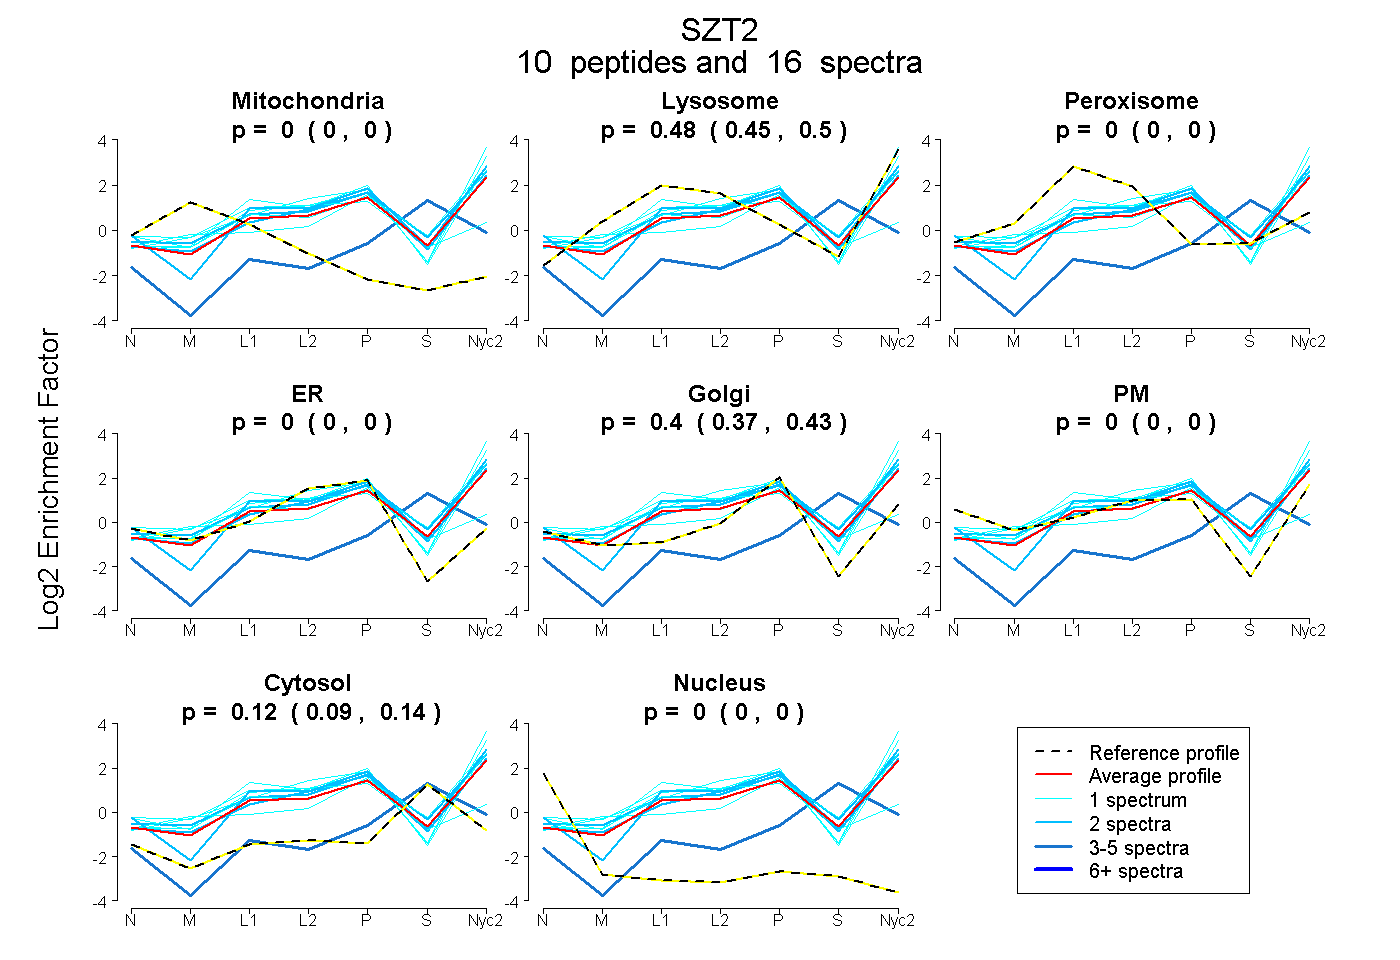
| Plot | Mito | Lyso | Perox | ER | Golgi | PM | Cytosol | Nucleus | |||||
| Expt A |
10 peptides |
16 spectra |
|
0.000 0.000 | 0.000 |
0.477 0.451 | 0.502 |
0.000 0.000 | 0.000 |
0.000 0.000 | 0.000 |
0.404 0.373 | 0.429 |
0.000 0.000 | 0.000 |
0.118 0.094 | 0.137 |
0.000 0.000 | 0.000 |
| 2 spectra, TTDDIVLDRPEDTR | 0.000 | 0.461 | 0.000 | 0.000 | 0.378 | 0.094 | 0.067 | 0.000 | ||
| 1 spectrum, LGLFHHCGQLDFPVR | 0.000 | 0.000 | 0.257 | 0.000 | 0.612 | 0.000 | 0.131 | 0.000 | ||
| 1 spectrum, HLQQLLVR | 0.000 | 0.594 | 0.000 | 0.000 | 0.393 | 0.013 | 0.000 | 0.000 | ||
| 1 spectrum, SASSSLASLSR | 0.000 | 0.579 | 0.000 | 0.000 | 0.301 | 0.000 | 0.120 | 0.000 | ||
| 2 spectra, LGFPIGTPAQAR | 0.000 | 0.506 | 0.000 | 0.000 | 0.434 | 0.029 | 0.032 | 0.000 | ||
| 2 spectra, LAQWQNAR | 0.000 | 0.521 | 0.000 | 0.000 | 0.373 | 0.000 | 0.106 | 0.000 | ||
| 1 spectrum, STSESSASFPR | 0.000 | 0.521 | 0.000 | 0.000 | 0.094 | 0.320 | 0.065 | 0.000 | ||
| 1 spectrum, APGSDSGAQR | 0.000 | 0.507 | 0.000 | 0.000 | 0.251 | 0.242 | 0.000 | 0.000 | ||
| 4 spectra, ALFTLR | 0.000 | 0.000 | 0.000 | 0.000 | 0.039 | 0.000 | 0.961 | 0.000 | ||
| 1 spectrum, HLLLLGR | 0.000 | 0.665 | 0.000 | 0.000 | 0.309 | 0.026 | 0.000 | 0.000 |
| Plot | Mito | Lyso or Perox | ER | Golgi | PM | Cytosol | Nucleus | ||||||
| Expt B |
5 peptides |
7 spectra |
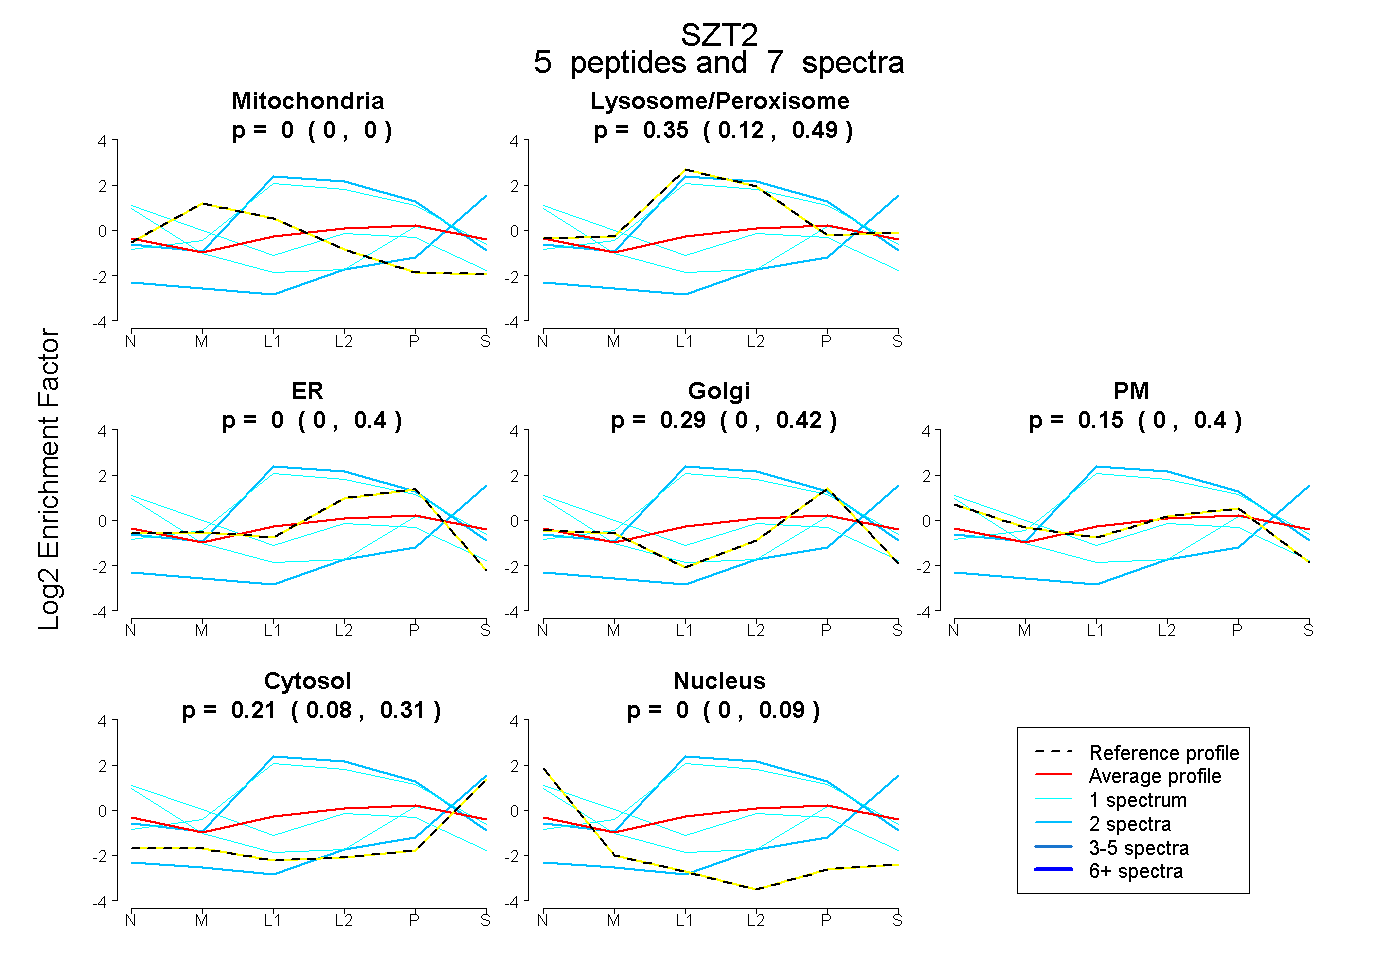 |
0.000 0.000 | 0.000 |
0.351 0.123 | 0.492 |
0.000 0.000 | 0.397 |
0.289 0.000 | 0.416 |
0.147 0.000 | 0.400 |
0.213 0.084 | 0.314 |
0.000 0.000 | 0.090 |
|||
| Plot | Lyso | Other | |||||||||||
| Expt C |
29 peptides |
62 spectra |
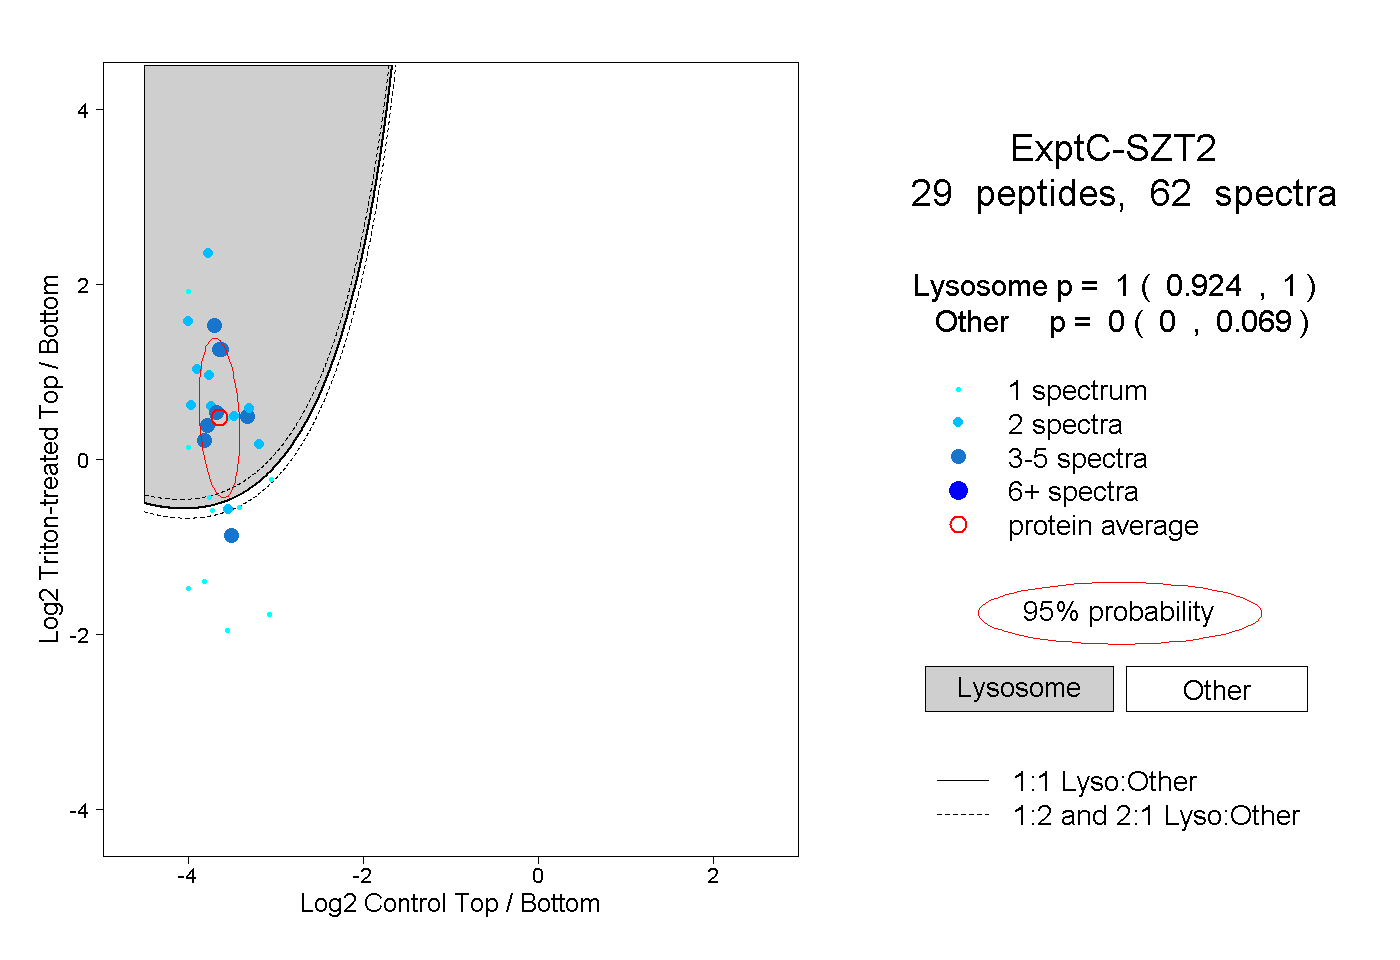 |
1.000 0.924 | 1.000 |
0.000 0.000 | 0.069 |