 46
46peptides
spectra
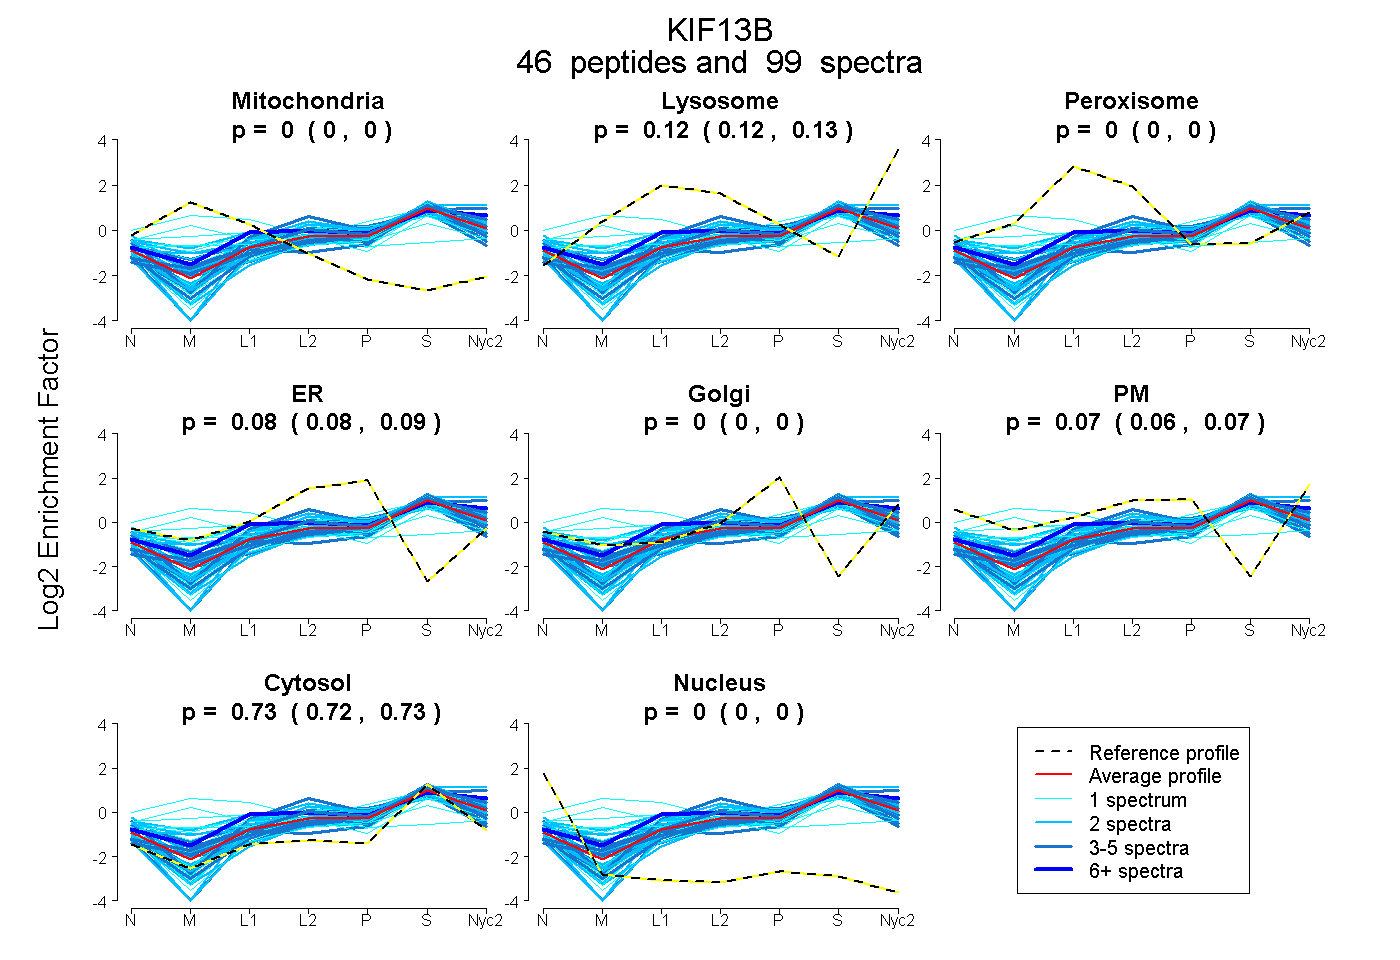
0.000 | 0.000
0.121 | 0.126
0.000 | 0.000
0.080 | 0.088
0.000 | 0.000
0.061 | 0.072
0.723 | 0.727
0.000 | 0.000
9peptides
spectra
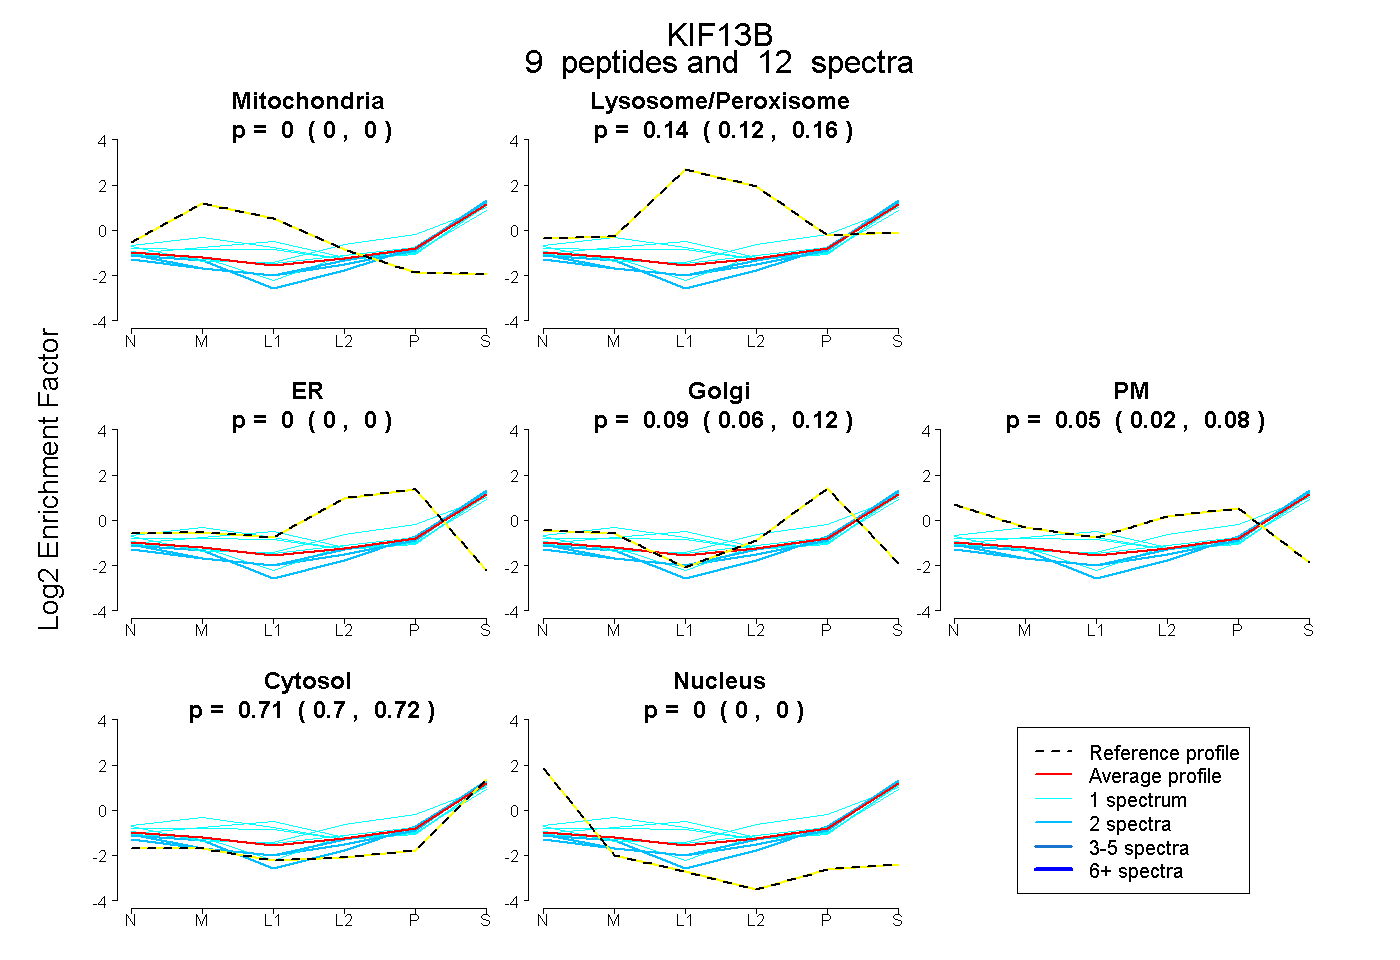
0.000 | 0.000
0.116 | 0.164
0.000 | 0.000
0.064 | 0.117
0.015 | 0.080
0.700 | 0.722
0.000 | 0.000
28peptides
spectra
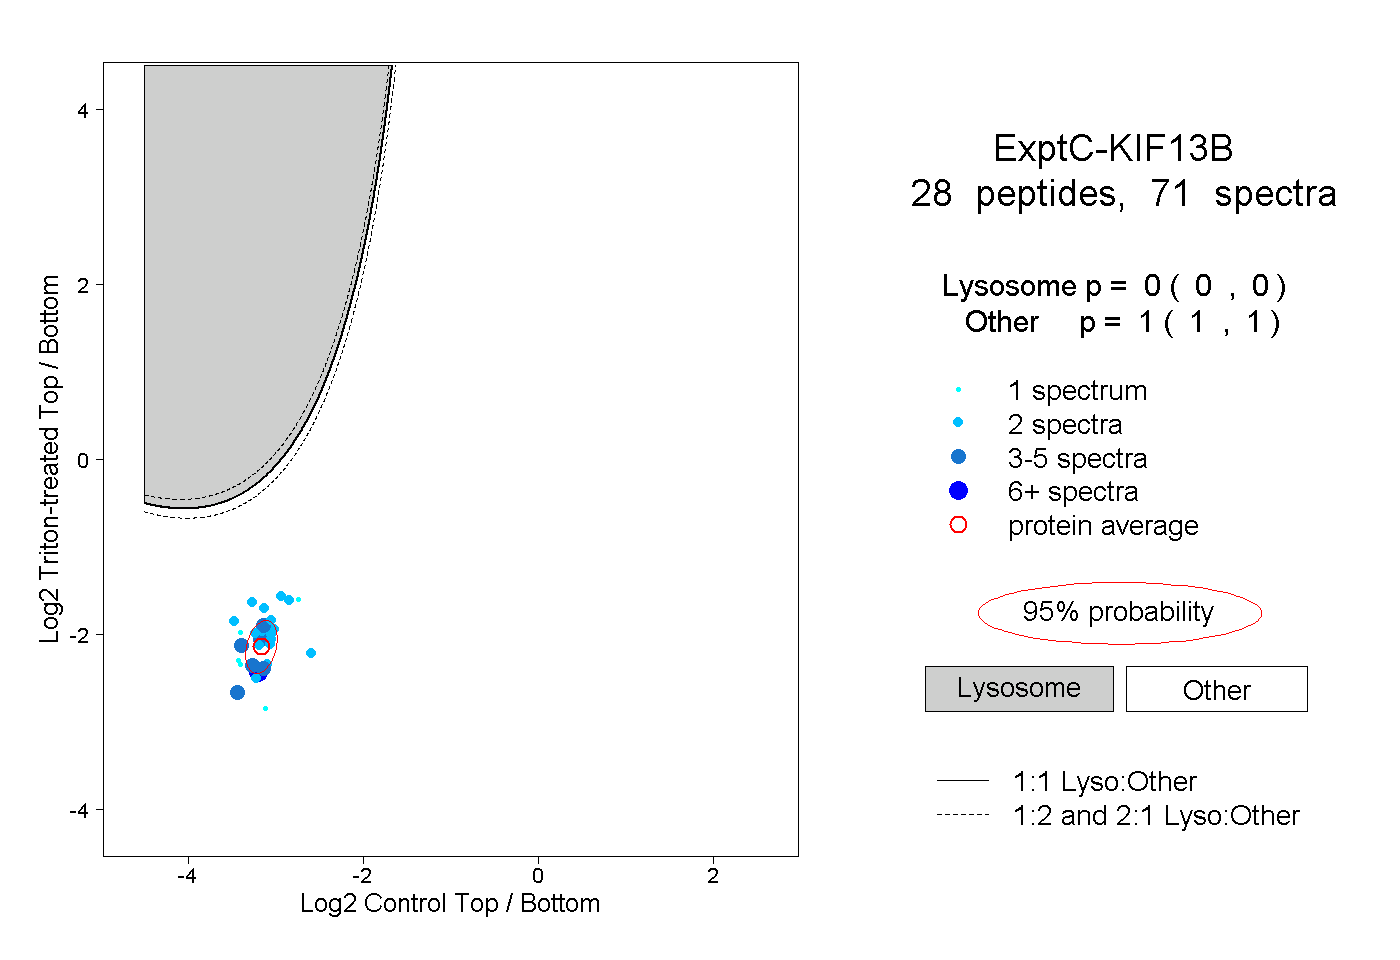
0.000 | 0.000
1.000 | 1.000
3peptides
spectra
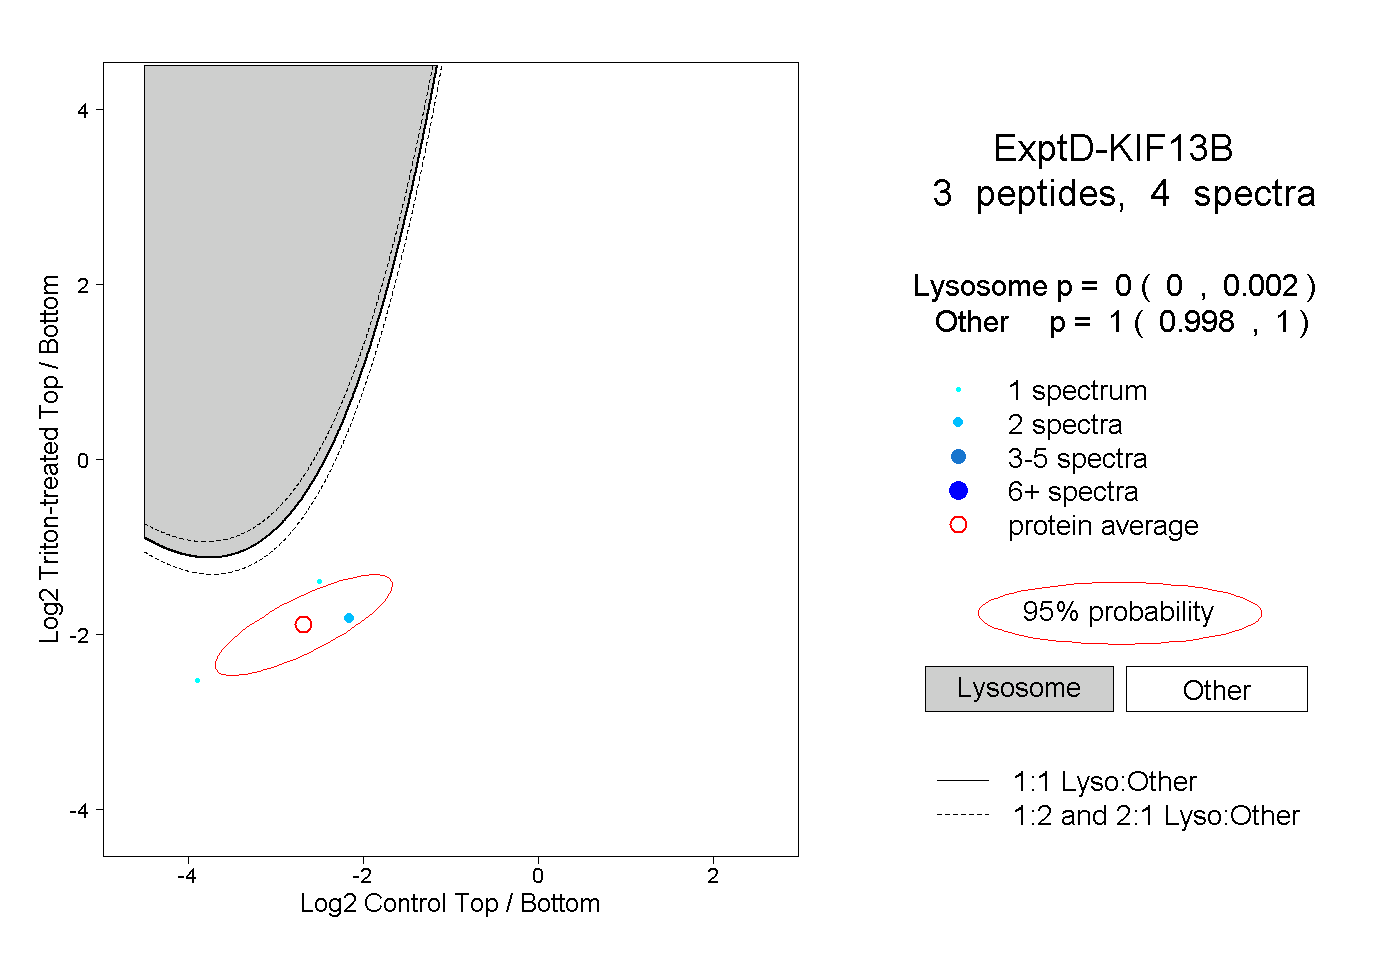
0.000 | 0.002
0.998 | 1.000