 8
8peptides
spectra
0.000 | 0.000
0.000 | 0.000
0.000 | 0.033
0.163 | 0.339
0.000 | 0.000
0.000 | 0.189
0.183 | 0.249
0.393 | 0.447
1peptide
spectrum
NA | NA
NA | NA
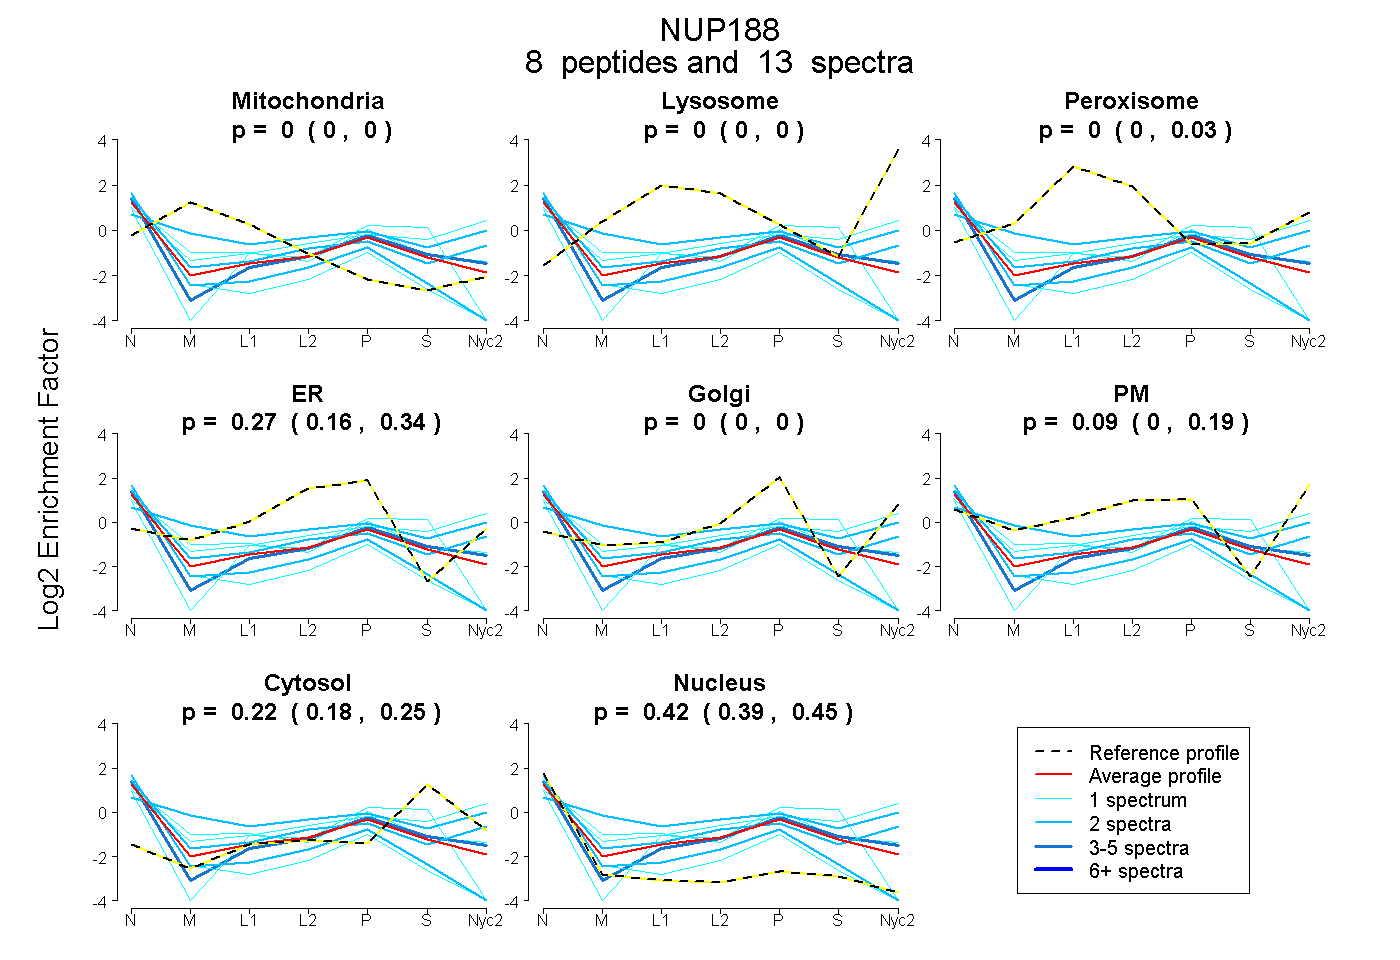
| Plot | Mito | Lyso | Perox | ER | Golgi | PM | Cytosol | Nucleus | |||||
| Expt A |
8 peptides |
13 spectra |
|
0.000 0.000 | 0.000 |
0.000 0.000 | 0.000 |
0.000 0.000 | 0.033 |
0.270 0.163 | 0.339 |
0.000 0.000 | 0.000 |
0.088 0.000 | 0.189 |
0.223 0.183 | 0.249 |
0.419 0.393 | 0.447 |
||
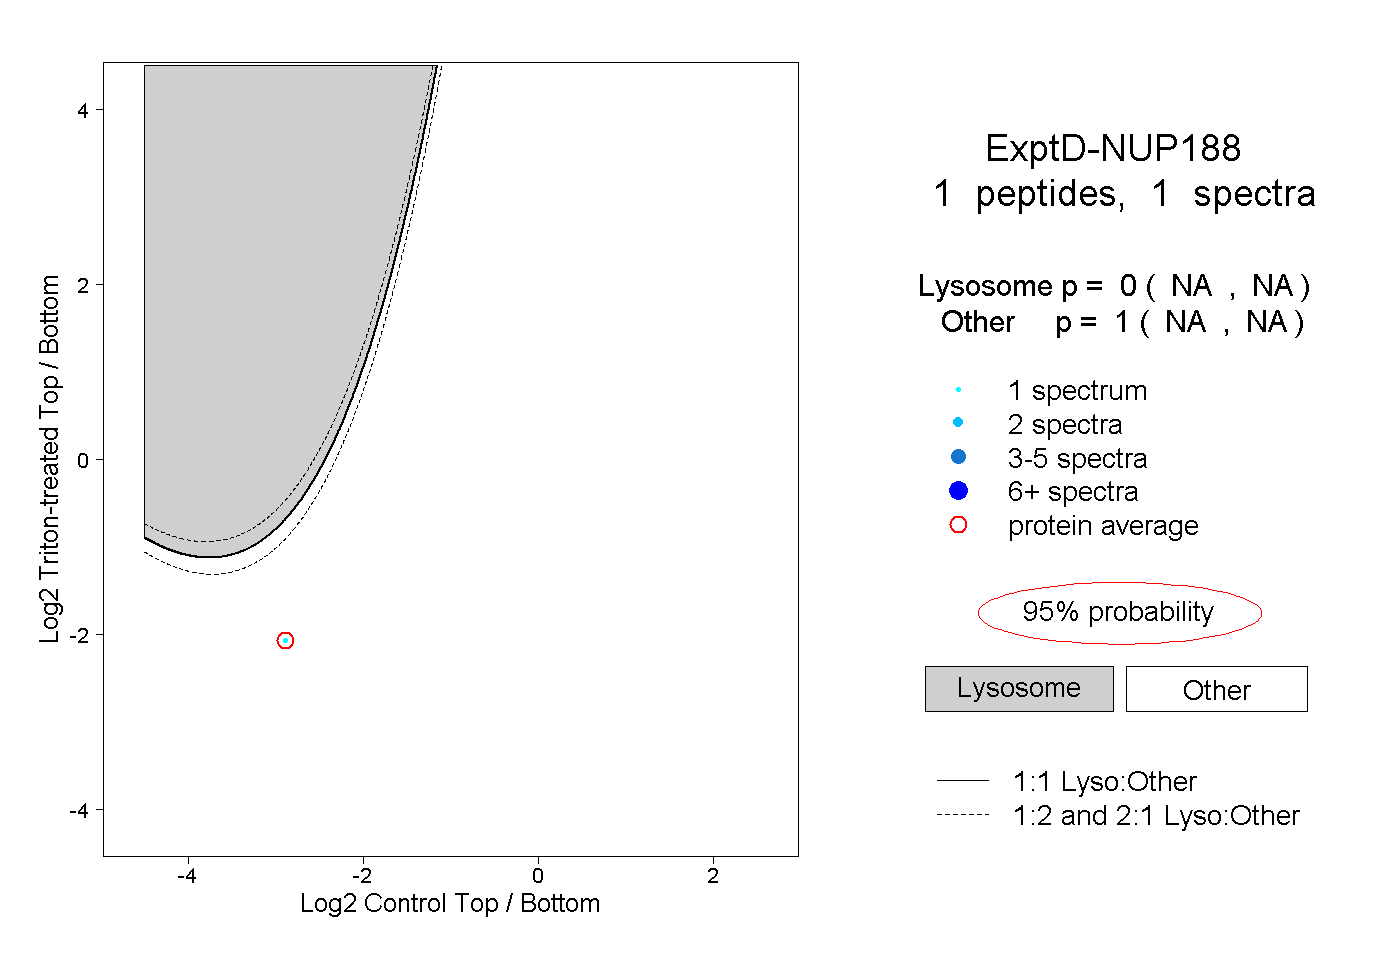
| Plot | Lyso | Other | |||||||||||
| Expt D |
1 peptide |
1 spectrum |
|
0.000 NA | NA |
1.000 NA | NA |