 8
8peptides
spectra
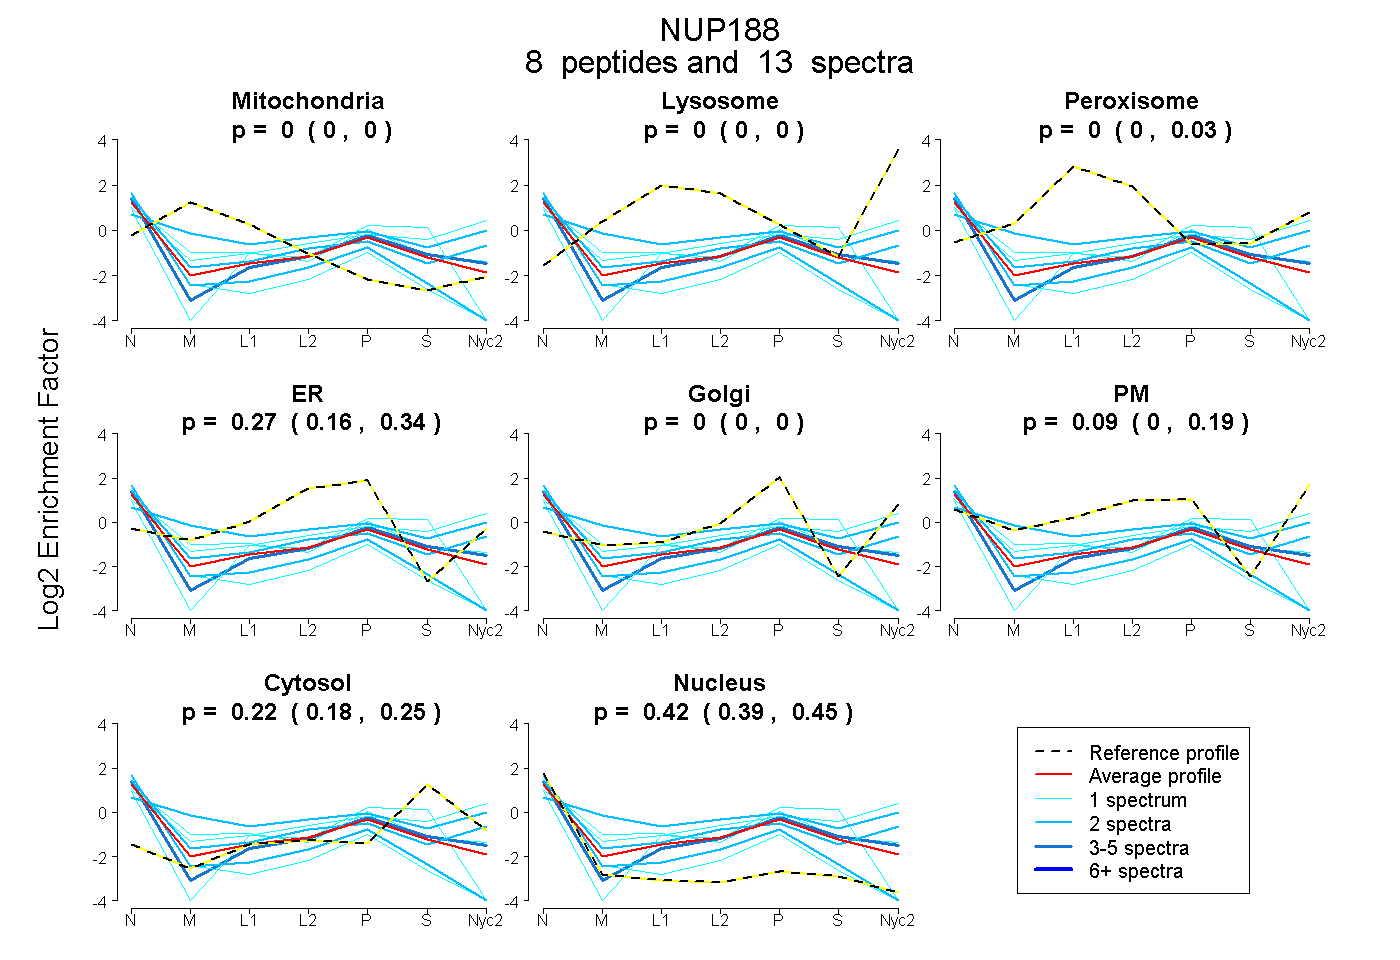
0.000 | 0.000
0.000 | 0.000
0.000 | 0.033
0.163 | 0.339
0.000 | 0.000
0.000 | 0.189
0.183 | 0.249
0.393 | 0.447
| Plot | Mito | Lyso | Perox | ER | Golgi | PM | Cytosol | Nucleus | |||||
| Expt A |
8 peptides |
13 spectra |
|
0.000 0.000 | 0.000 |
0.000 0.000 | 0.000 |
0.000 0.000 | 0.033 |
0.270 0.163 | 0.339 |
0.000 0.000 | 0.000 |
0.088 0.000 | 0.189 |
0.223 0.183 | 0.249 |
0.419 0.393 | 0.447 |
| 2 spectra, YWCPPLLHR | 0.183 | 0.000 | 0.000 | 0.000 | 0.000 | 0.498 | 0.281 | 0.039 | ||
| 2 spectra, TVLQDER | 0.000 | 0.000 | 0.000 | 0.000 | 0.000 | 0.473 | 0.165 | 0.362 | ||
| 2 spectra, TLQCLNAVR | 0.000 | 0.000 | 0.000 | 0.251 | 0.000 | 0.000 | 0.000 | 0.749 | ||
| 3 spectra, HLVDETMDPFVDR | 0.000 | 0.000 | 0.000 | 0.130 | 0.105 | 0.090 | 0.267 | 0.408 | ||
| 1 spectrum, FAYWSGYVK | 0.015 | 0.000 | 0.187 | 0.000 | 0.328 | 0.003 | 0.091 | 0.376 | ||
| 1 spectrum, LAFSVTNNVIR | 0.000 | 0.000 | 0.000 | 0.181 | 0.000 | 0.000 | 0.000 | 0.819 | ||
| 1 spectrum, LLEGLSYYRPPSPSSAER | 0.000 | 0.000 | 0.000 | 0.000 | 0.000 | 0.505 | 0.371 | 0.124 | ||
| 1 spectrum, LLYPLGGQTNLR | 0.000 | 0.000 | 0.000 | 0.158 | 0.000 | 0.000 | 0.433 | 0.409 |
| Plot | Lyso | Other | |||||||||||
| Expt D |
1 peptide |
1 spectrum |
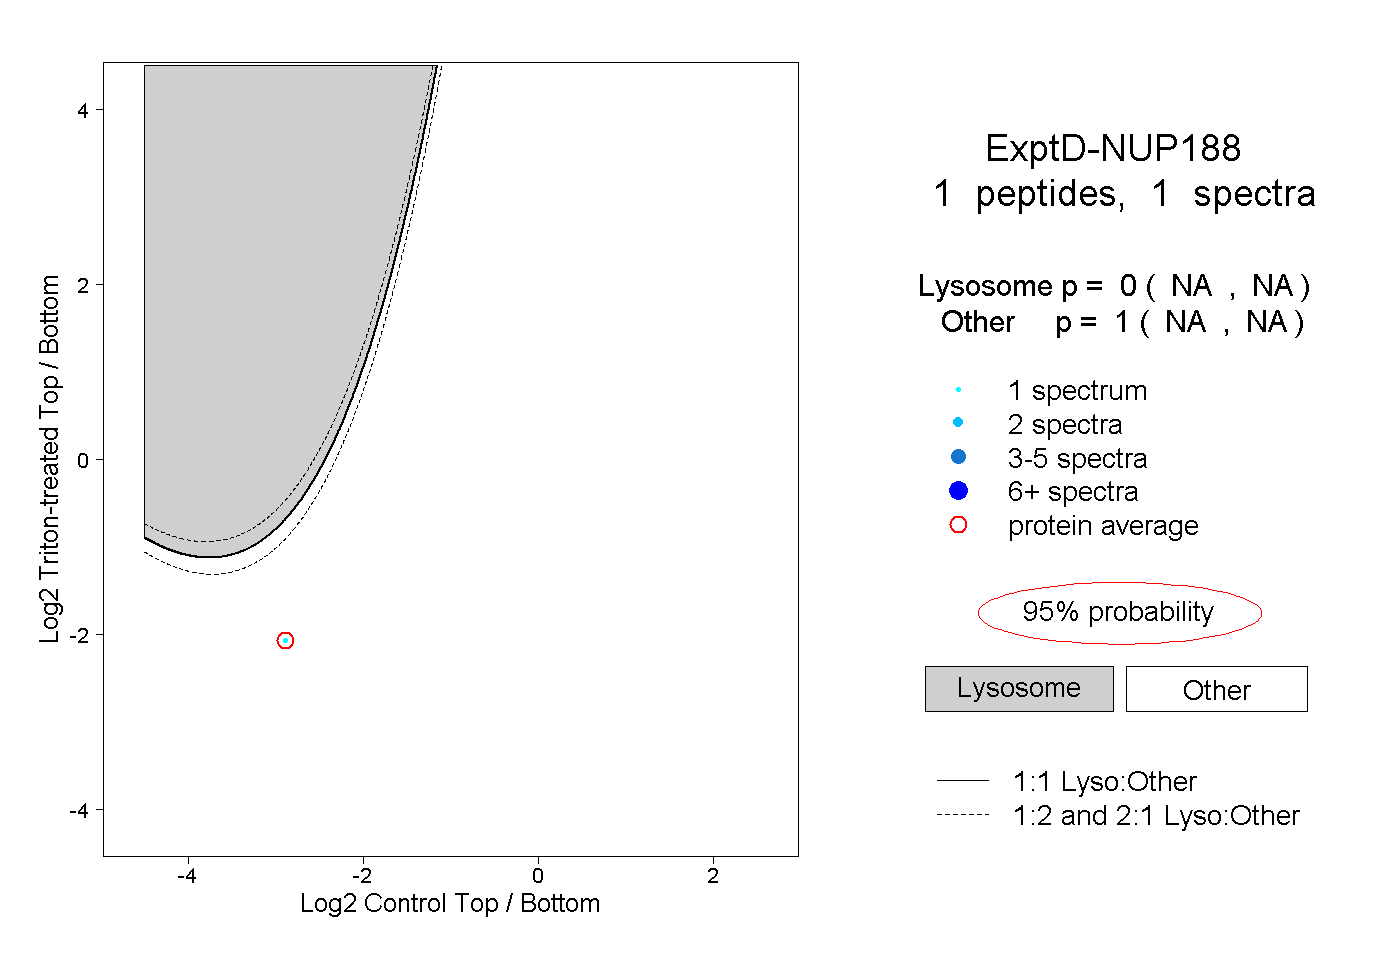 |
0.000 NA | NA |
1.000 NA | NA |