 7
7peptides
spectra
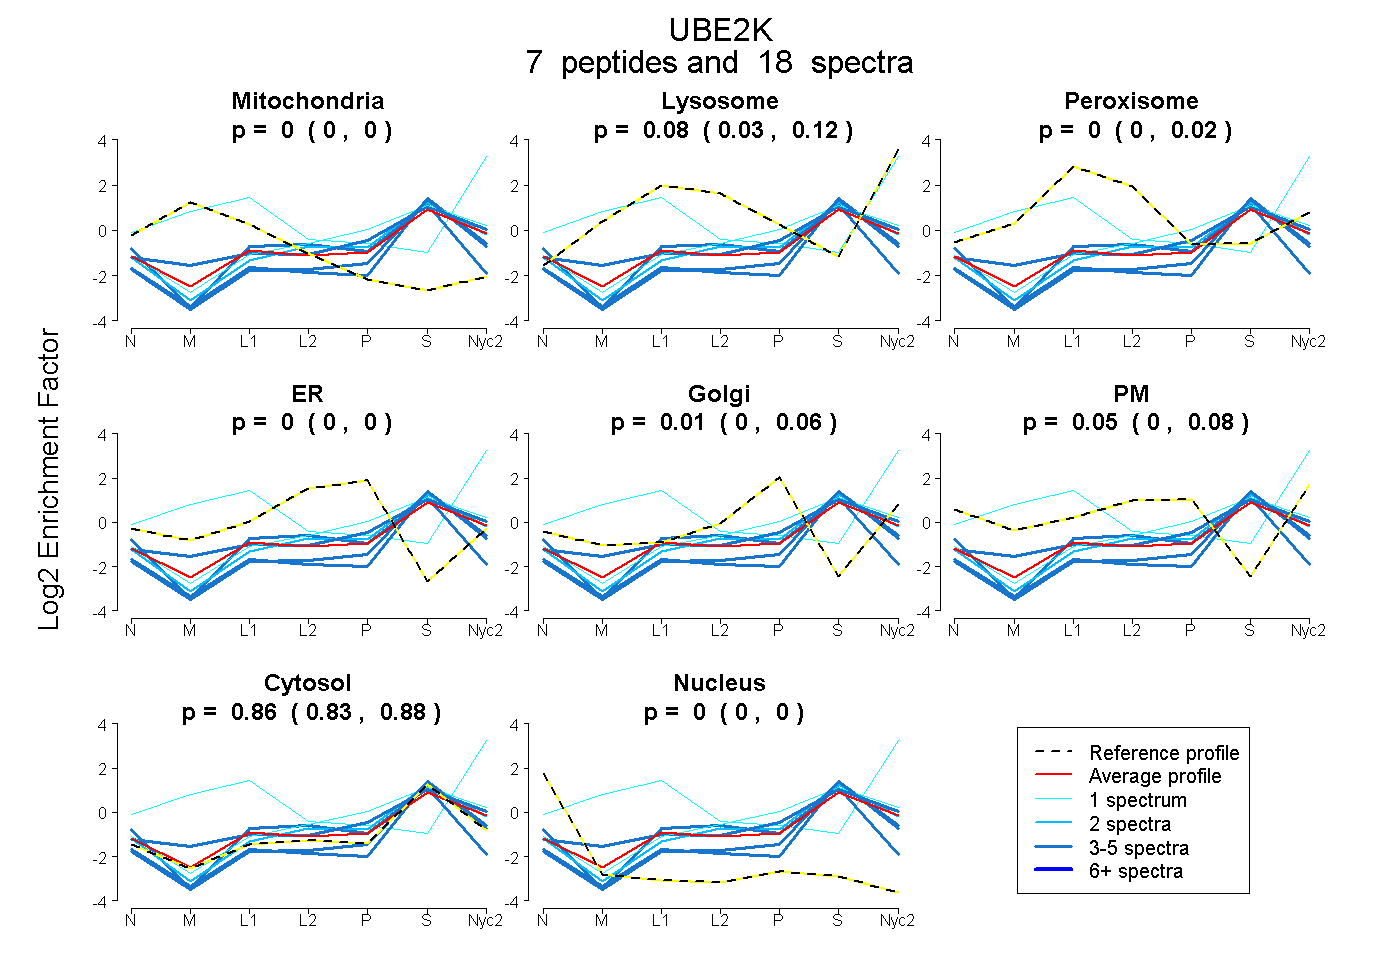
0.000 | 0.000
0.027 | 0.118
0.000 | 0.024
0.000 | 0.000
0.000 | 0.061
0.000 | 0.084
0.825 | 0.876
0.000 | 0.000
1peptide
spectrum
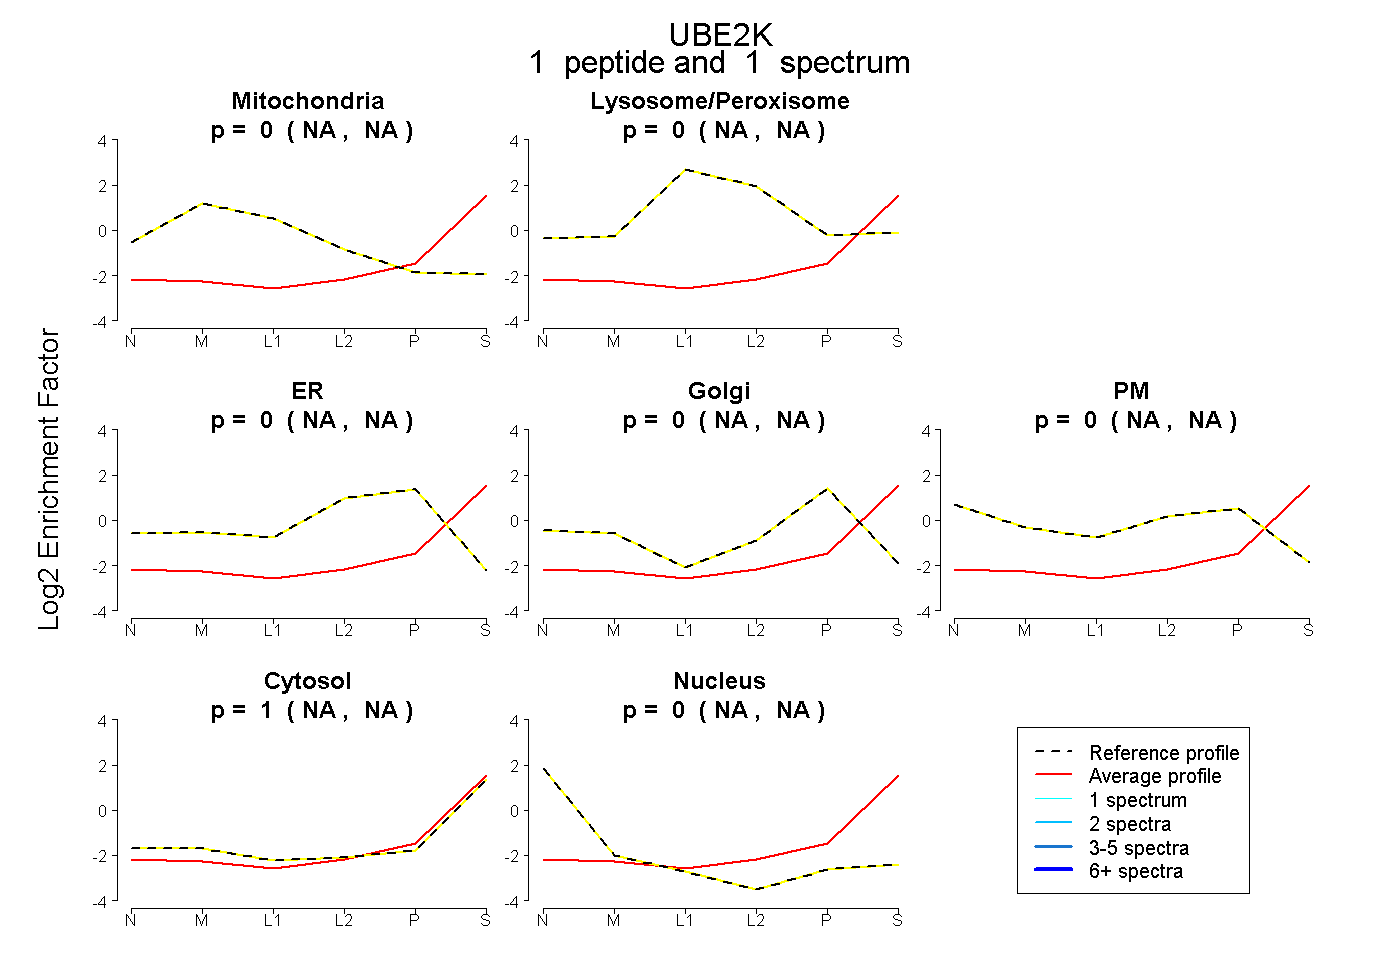
NA | NA
NA | NA
NA | NA
NA | NA
NA | NA
NA | NA
NA | NA
6peptides
spectra
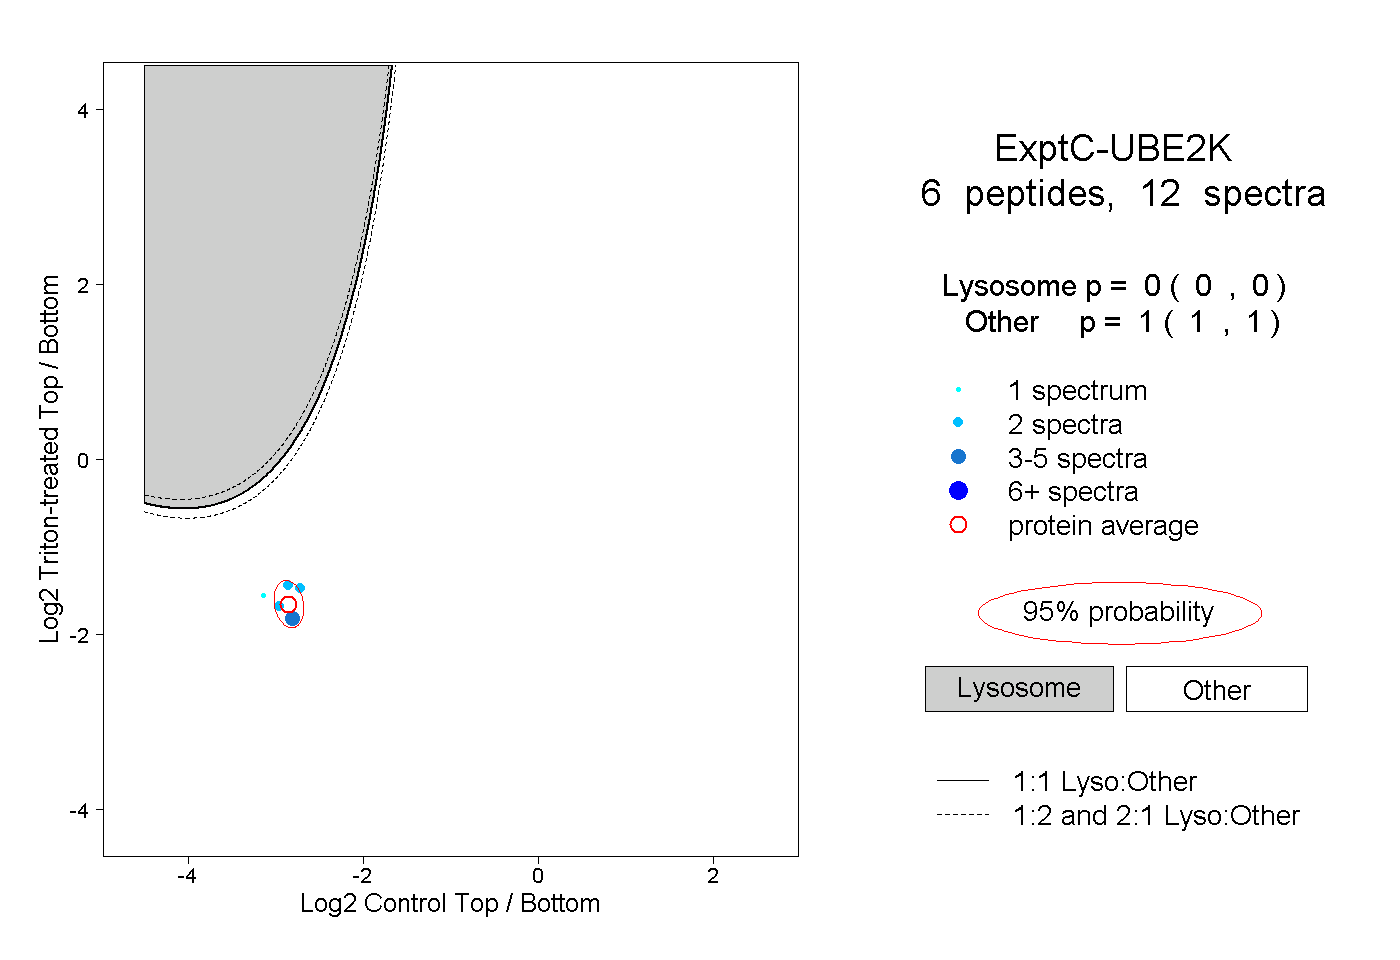
0.000 | 0.000
1.000 | 1.000