 7
7peptides
spectra
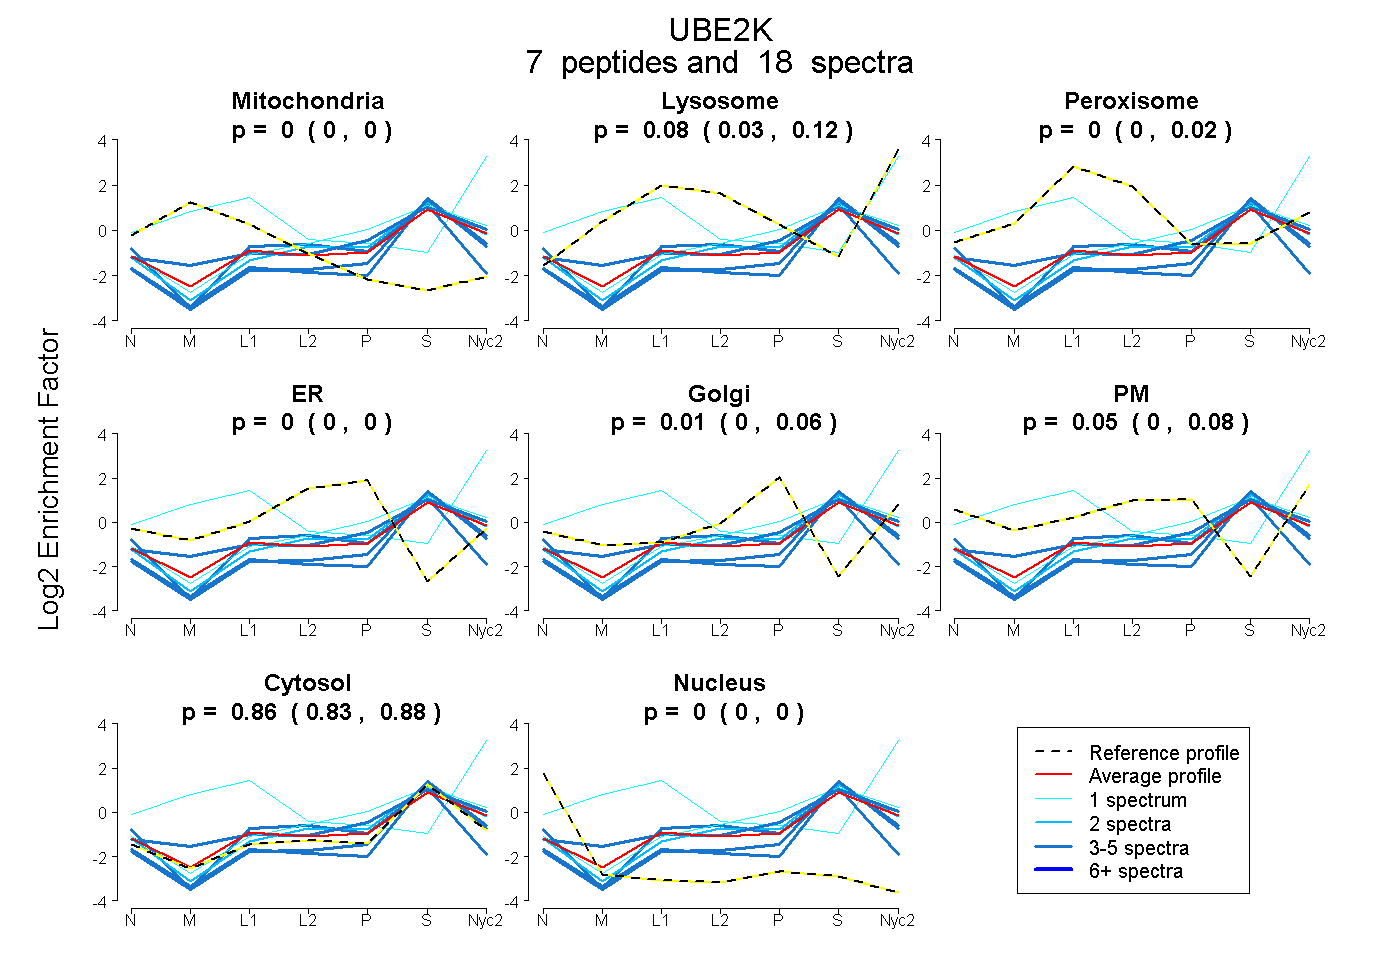
0.000 | 0.000
0.027 | 0.118
0.000 | 0.024
0.000 | 0.000
0.000 | 0.061
0.000 | 0.084
0.825 | 0.876
0.000 | 0.000
| Plot | Mito | Lyso | Perox | ER | Golgi | PM | Cytosol | Nucleus | |||||
| Expt A |
7 peptides |
18 spectra |
|
0.000 0.000 | 0.000 |
0.080 0.027 | 0.118 |
0.000 0.000 | 0.024 |
0.000 0.000 | 0.000 |
0.012 0.000 | 0.061 |
0.052 0.000 | 0.084 |
0.856 0.825 | 0.876 |
0.000 0.000 | 0.000 |
| 4 spectra, QNPEMFK | 0.000 | 0.137 | 0.000 | 0.000 | 0.100 | 0.000 | 0.763 | 0.000 | ||
| 3 spectra, GEIAGPPDTPYEGGR | 0.000 | 0.000 | 0.008 | 0.070 | 0.000 | 0.000 | 0.865 | 0.057 | ||
| 3 spectra, DQWAAAMTLR | 0.000 | 0.000 | 0.000 | 0.000 | 0.000 | 0.000 | 0.993 | 0.007 | ||
| 1 spectrum, ANIAVQR | 0.086 | 0.809 | 0.000 | 0.000 | 0.000 | 0.000 | 0.000 | 0.105 | ||
| 4 spectra, VDLVDENFTELR | 0.000 | 0.000 | 0.000 | 0.000 | 0.000 | 0.000 | 1.000 | 0.000 | ||
| 1 spectrum, SEETSK | 0.000 | 0.080 | 0.000 | 0.000 | 0.172 | 0.000 | 0.749 | 0.000 | ||
| 2 spectra, NAVIVALSSK | 0.000 | 0.035 | 0.000 | 0.000 | 0.069 | 0.000 | 0.897 | 0.000 |
| Plot | Mito | Lyso or Perox | ER | Golgi | PM | Cytosol | Nucleus | ||||||
| Expt B |
1 peptide |
1 spectrum |
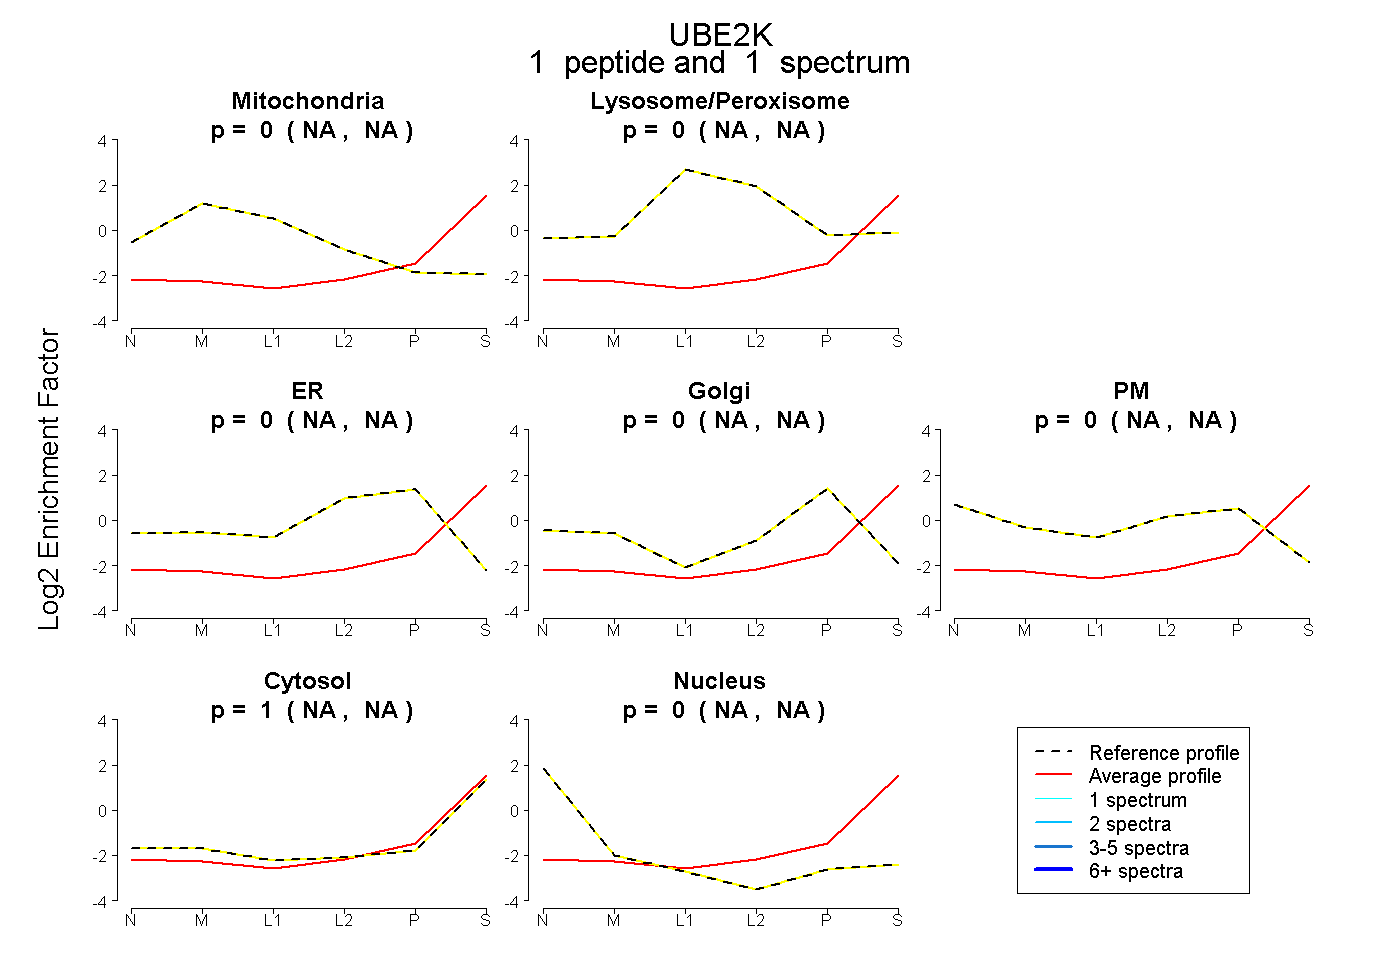 |
0.000 NA | NA |
0.000 NA | NA |
0.000 NA | NA |
0.000 NA | NA |
0.000 NA | NA |
1.000 NA | NA |
0.000 NA | NA |
|||
| Plot | Lyso | Other | |||||||||||
| Expt C |
6 peptides |
12 spectra |
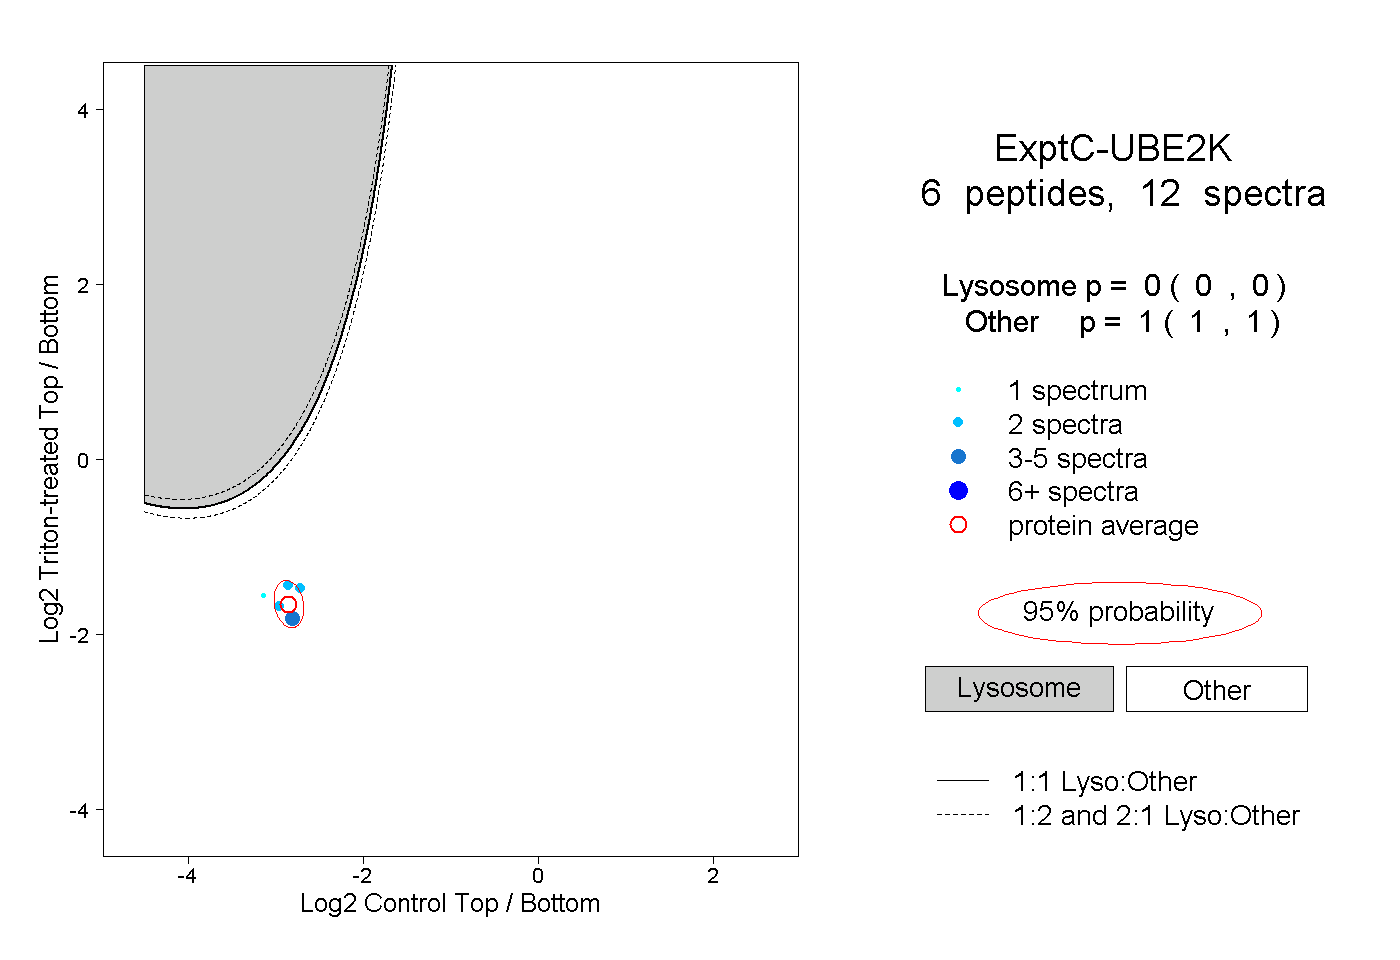 |
0.000 0.000 | 0.000 |
1.000 1.000 | 1.000 |