 6
6peptides
spectra
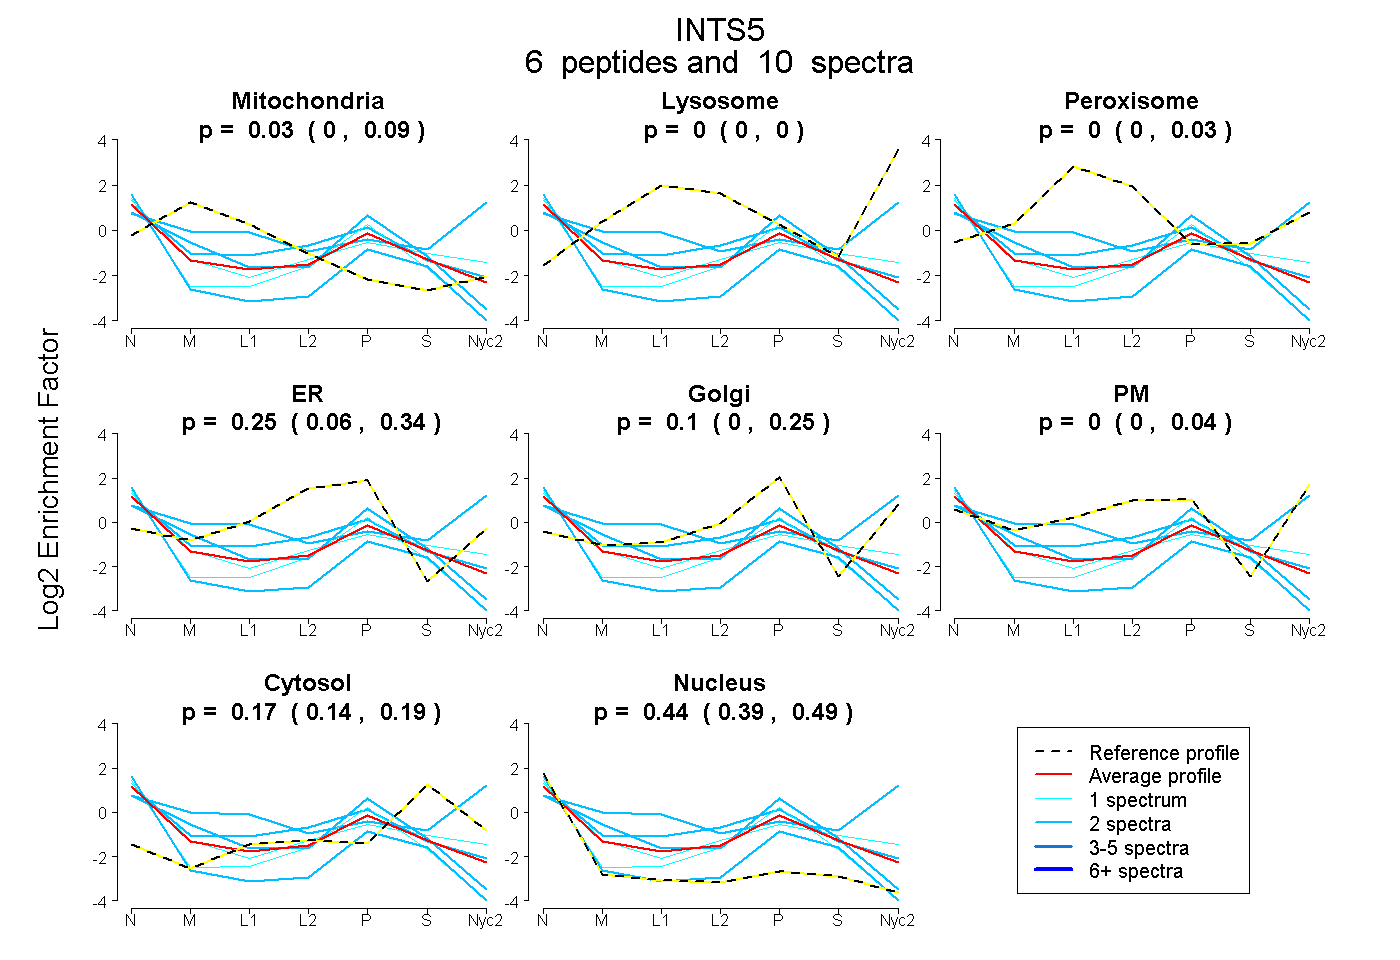
0.000 | 0.088
0.000 | 0.000
0.000 | 0.026
0.057 | 0.343
0.000 | 0.249
0.000 | 0.045
0.139 | 0.189
0.392 | 0.486
| Plot | Mito | Lyso | Perox | ER | Golgi | PM | Cytosol | Nucleus | |||||
| Expt A |
6 peptides |
10 spectra |
|
0.034 0.000 | 0.088 |
0.000 0.000 | 0.000 |
0.000 0.000 | 0.026 |
0.254 0.057 | 0.343 |
0.096 0.000 | 0.249 |
0.000 0.000 | 0.045 |
0.172 0.139 | 0.189 |
0.444 0.392 | 0.486 |