 6
6peptides
spectra
0.000 | 0.088
0.000 | 0.000
0.000 | 0.026
0.057 | 0.343
0.000 | 0.249
0.000 | 0.045
0.139 | 0.189
0.392 | 0.486
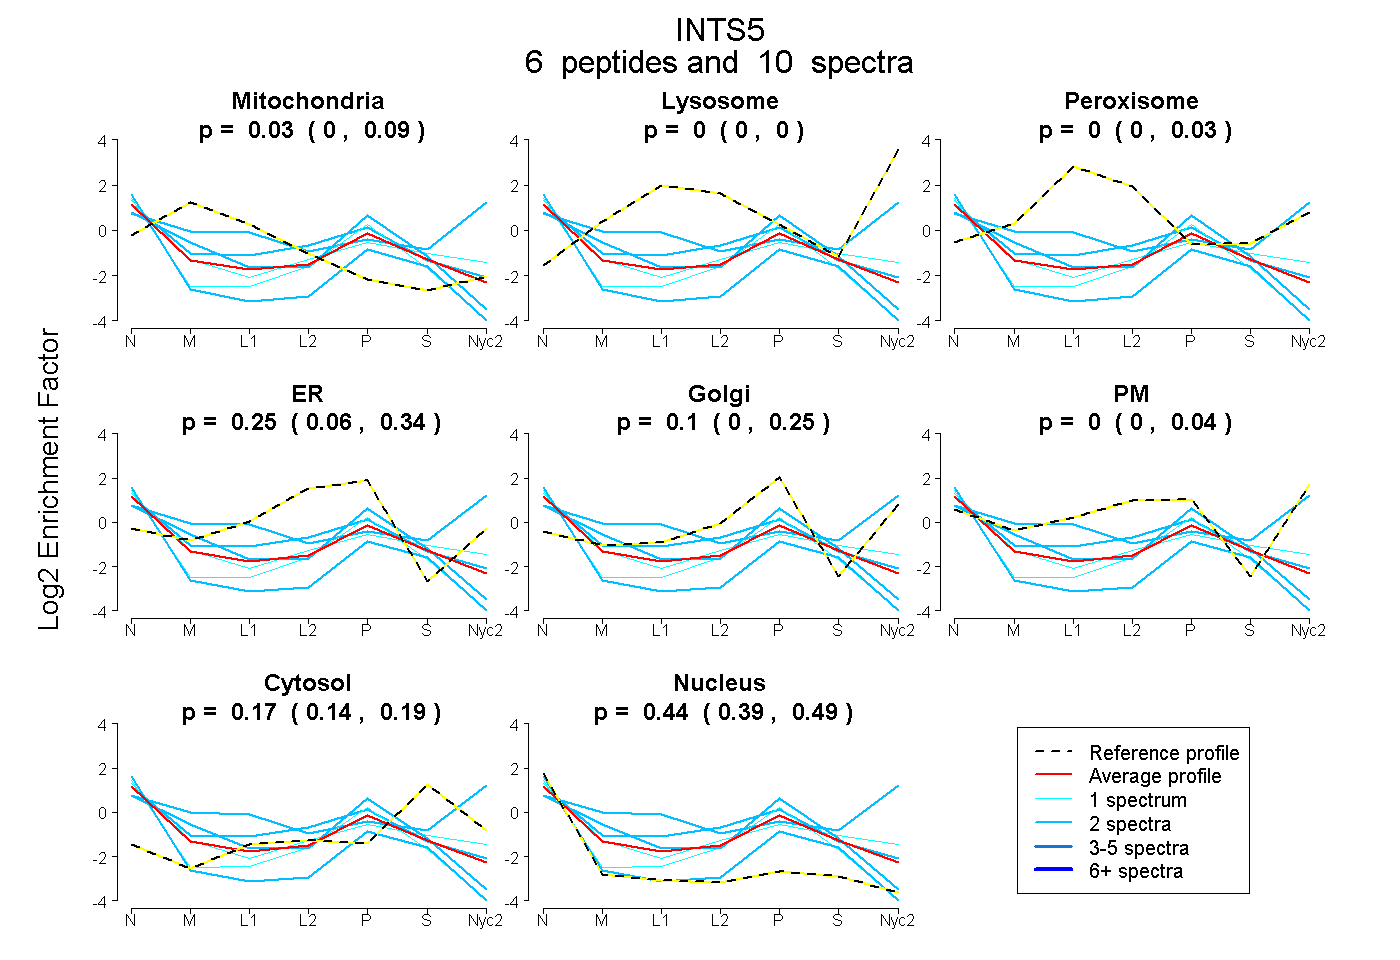
| Plot | Mito | Lyso | Perox | ER | Golgi | PM | Cytosol | Nucleus | |||||
| Expt A |
6 peptides |
10 spectra |
|
0.034 0.000 | 0.088 |
0.000 0.000 | 0.000 |
0.000 0.000 | 0.026 |
0.254 0.057 | 0.343 |
0.096 0.000 | 0.249 |
0.000 0.000 | 0.045 |
0.172 0.139 | 0.189 |
0.444 0.392 | 0.486 |
| 2 spectra, VHAGTLQPPFTAR | 0.131 | 0.000 | 0.000 | 0.338 | 0.000 | 0.000 | 0.115 | 0.416 | ||
| 2 spectra, LGLFSGR | 0.000 | 0.000 | 0.000 | 0.015 | 0.052 | 0.000 | 0.116 | 0.817 | ||
| 2 spectra, FQAPPPSTLLR | 0.025 | 0.000 | 0.073 | 0.415 | 0.000 | 0.000 | 0.113 | 0.374 | ||
| 1 spectrum, FFASLR | 0.000 | 0.000 | 0.000 | 0.000 | 0.053 | 0.296 | 0.231 | 0.420 | ||
| 1 spectrum, GGSPGEGVLGPPPPPRPVPFLDALR | 0.000 | 0.000 | 0.000 | 0.295 | 0.000 | 0.000 | 0.040 | 0.665 | ||
| 2 spectra, AFLTGADPILGHQLSAR | 0.100 | 0.233 | 0.000 | 0.000 | 0.000 | 0.362 | 0.177 | 0.128 |