 3
3peptides
spectra
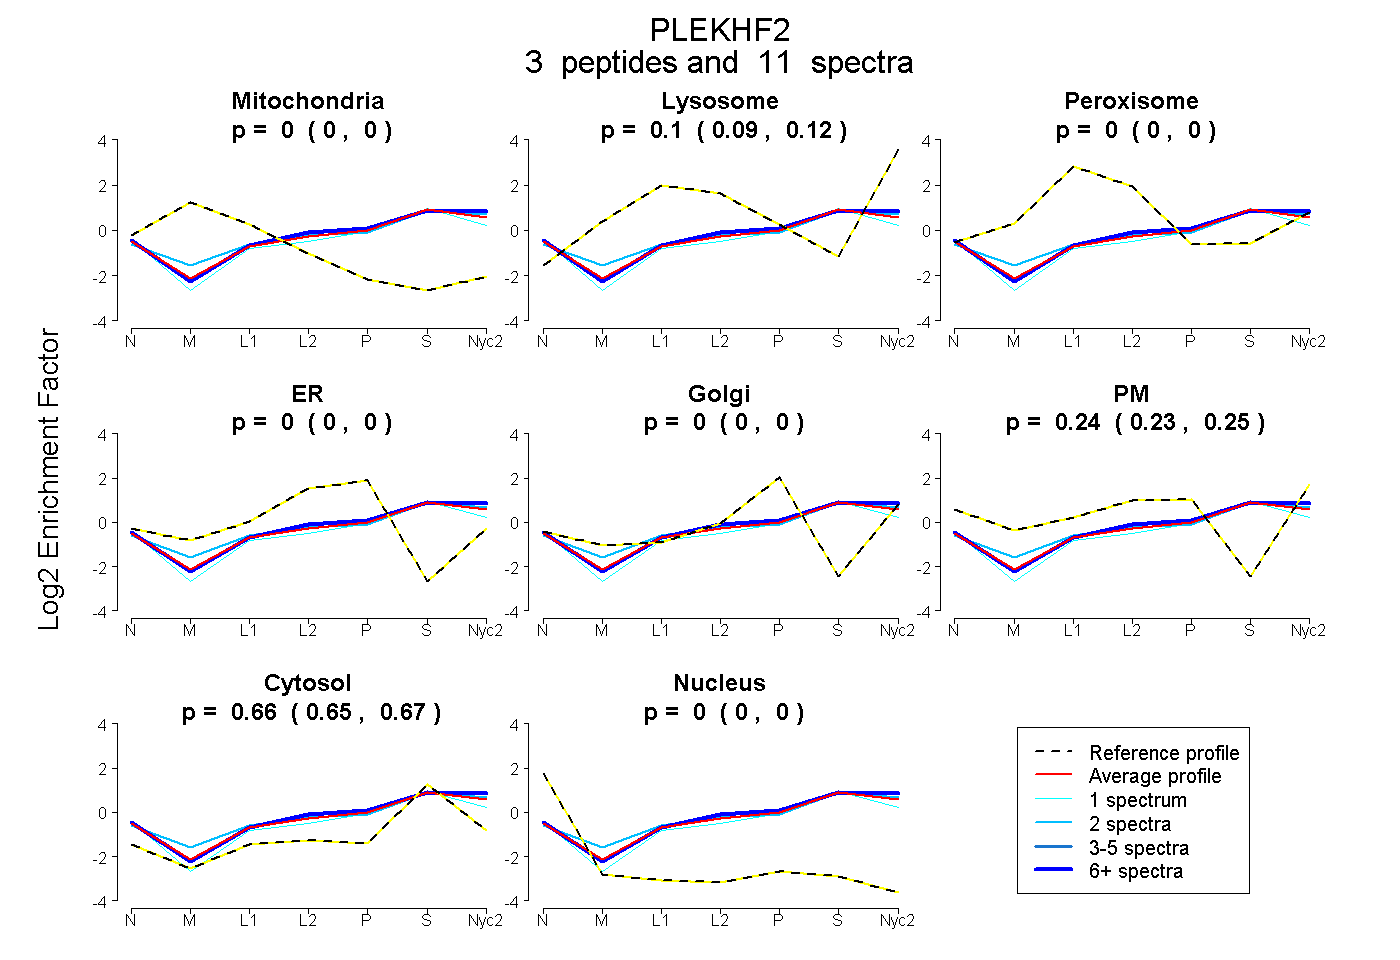
0.000 | 0.000
0.085 | 0.119
0.000 | 0.000
0.000 | 0.000
0.000 | 0.000
0.225 | 0.246
0.647 | 0.669
0.000 | 0.000
1peptide
spectrum
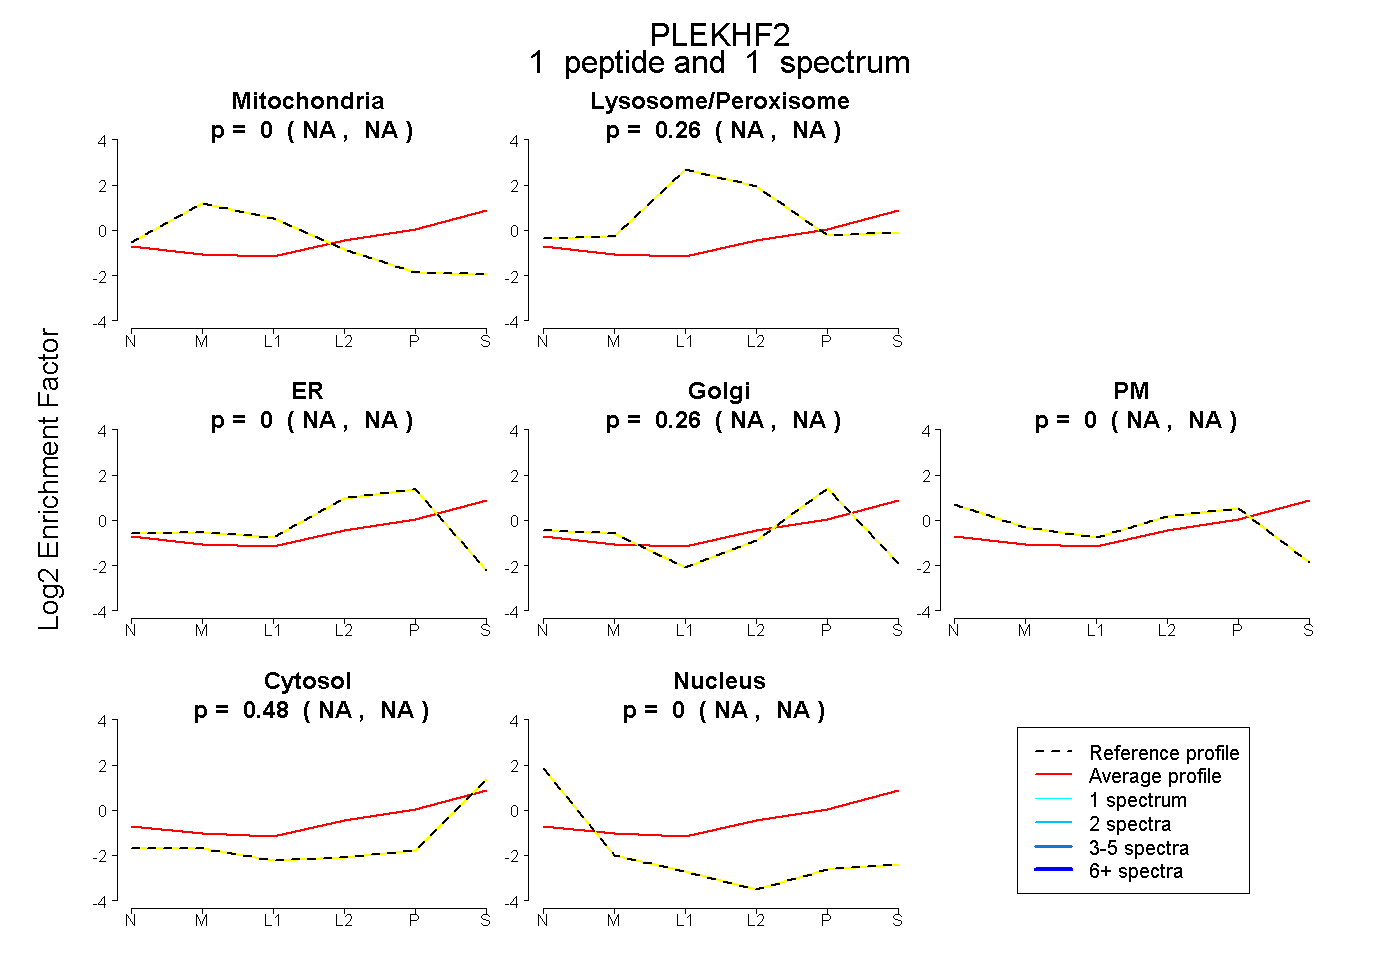
NA | NA
NA | NA
NA | NA
NA | NA
NA | NA
NA | NA
NA | NA
4peptides
spectra
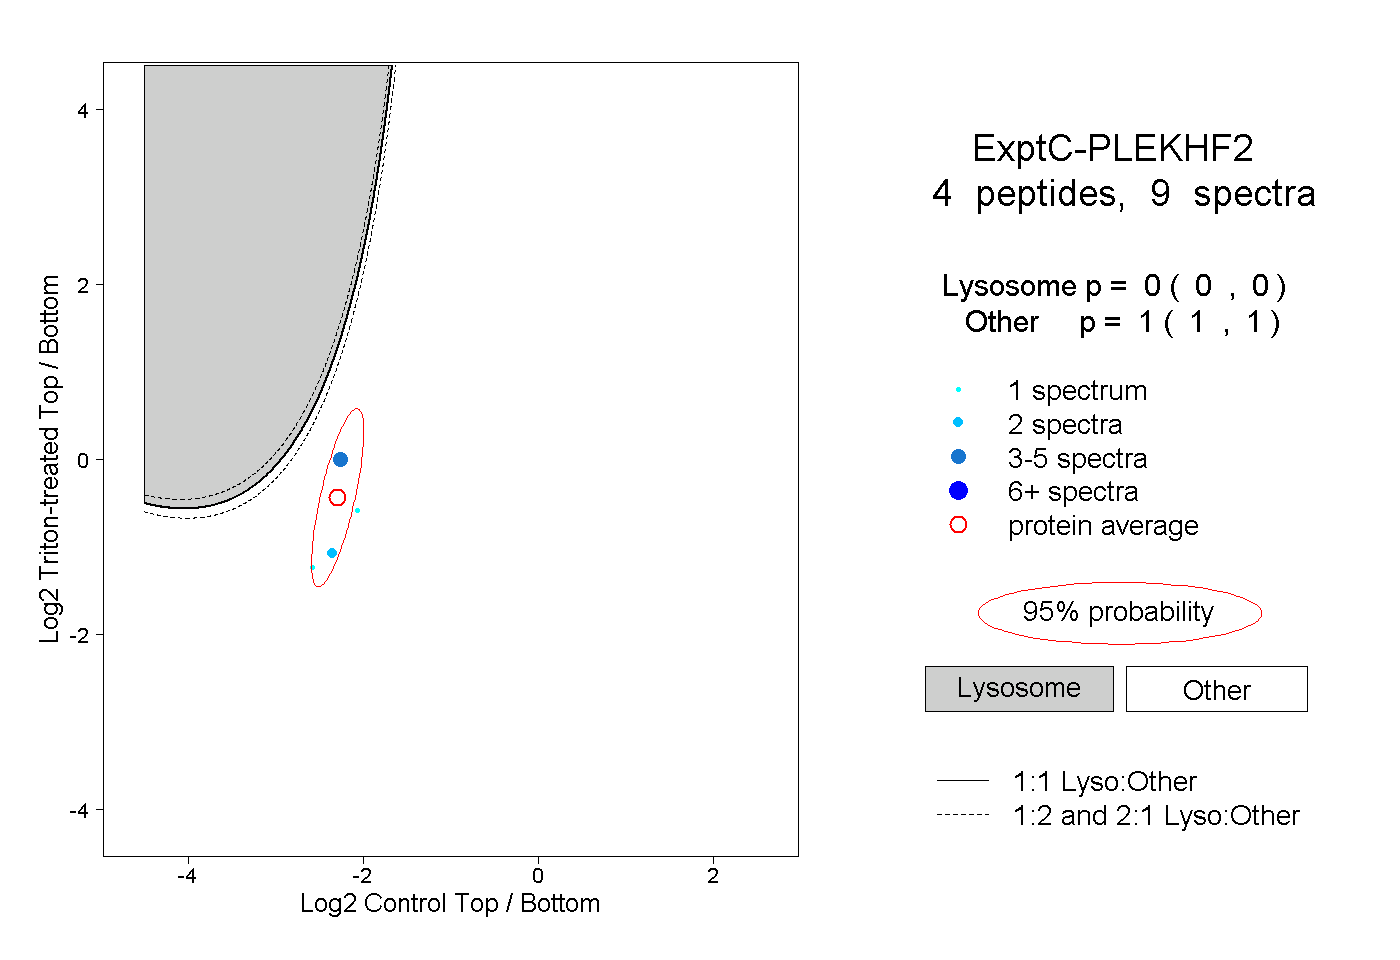
0.000 | 0.000
1.000 | 1.000