 3
3peptides
spectra
0.000 | 0.000
0.085 | 0.119
0.000 | 0.000
0.000 | 0.000
0.000 | 0.000
0.225 | 0.246
0.647 | 0.669
0.000 | 0.000
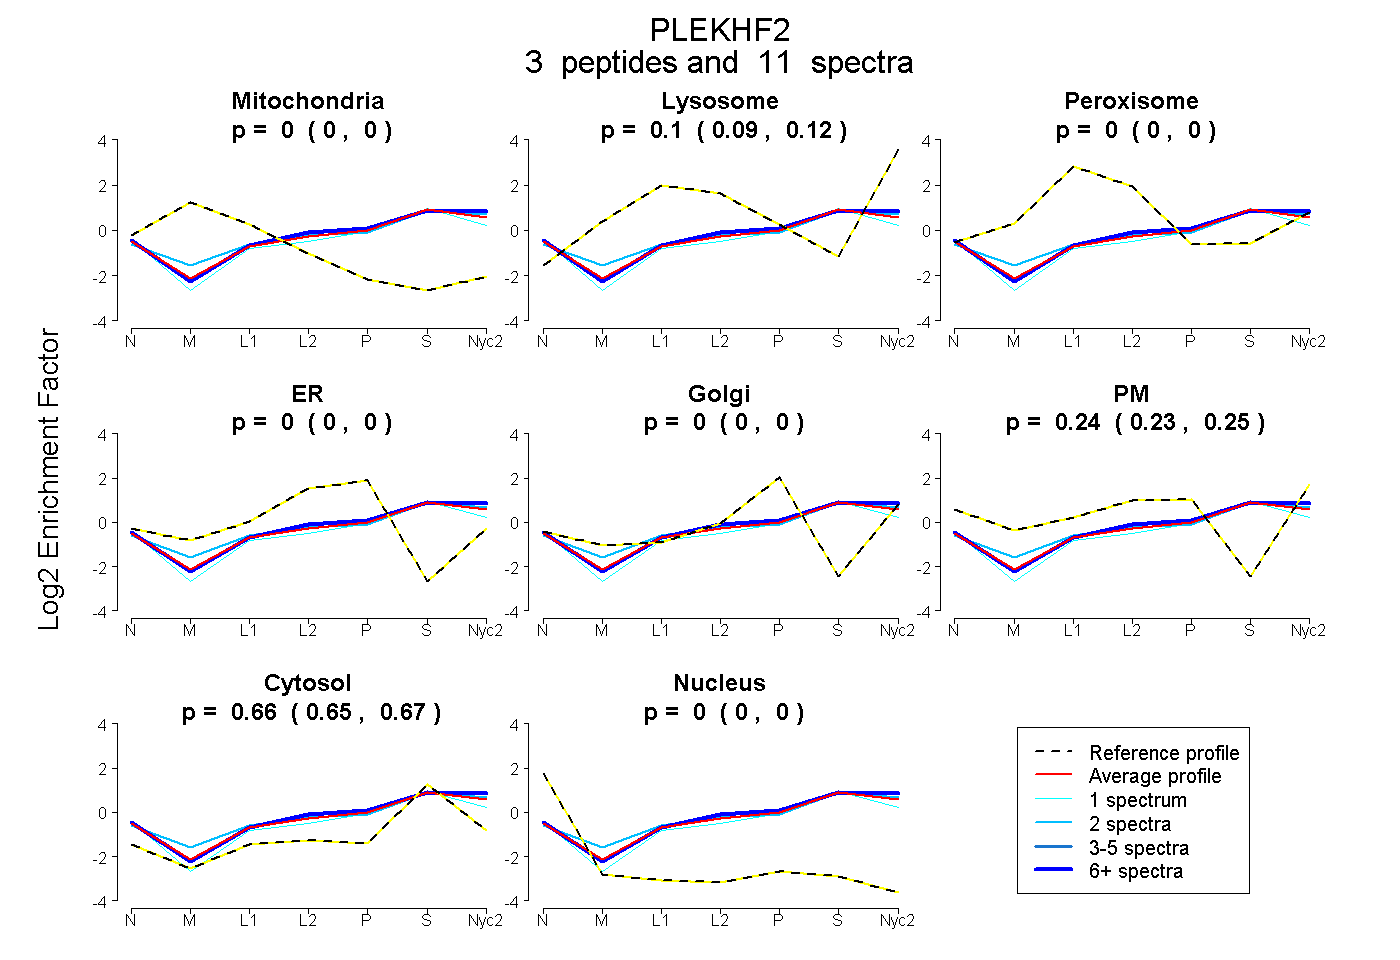
| Plot | Mito | Lyso | Perox | ER | Golgi | PM | Cytosol | Nucleus | |||||
| Expt A |
3 peptides |
11 spectra |
|
0.000 0.000 | 0.000 |
0.103 0.085 | 0.119 |
0.000 0.000 | 0.000 |
0.000 0.000 | 0.000 |
0.000 0.000 | 0.000 |
0.238 0.225 | 0.246 |
0.659 0.647 | 0.669 |
0.000 0.000 | 0.000 |
| 2 spectra, FTPVNR | 0.000 | 0.181 | 0.000 | 0.000 | 0.000 | 0.190 | 0.628 | 0.000 | ||
| 8 spectra, LANSEANTR | 0.000 | 0.132 | 0.000 | 0.000 | 0.000 | 0.235 | 0.632 | 0.000 | ||
| 1 spectrum, FLLPSQSSKPVR | 0.000 | 0.000 | 0.000 | 0.000 | 0.005 | 0.269 | 0.726 | 0.000 |
| Plot | Mito | Lyso or Perox | ER | Golgi | PM | Cytosol | Nucleus | ||||||
| Expt B |
1 peptide |
1 spectrum |
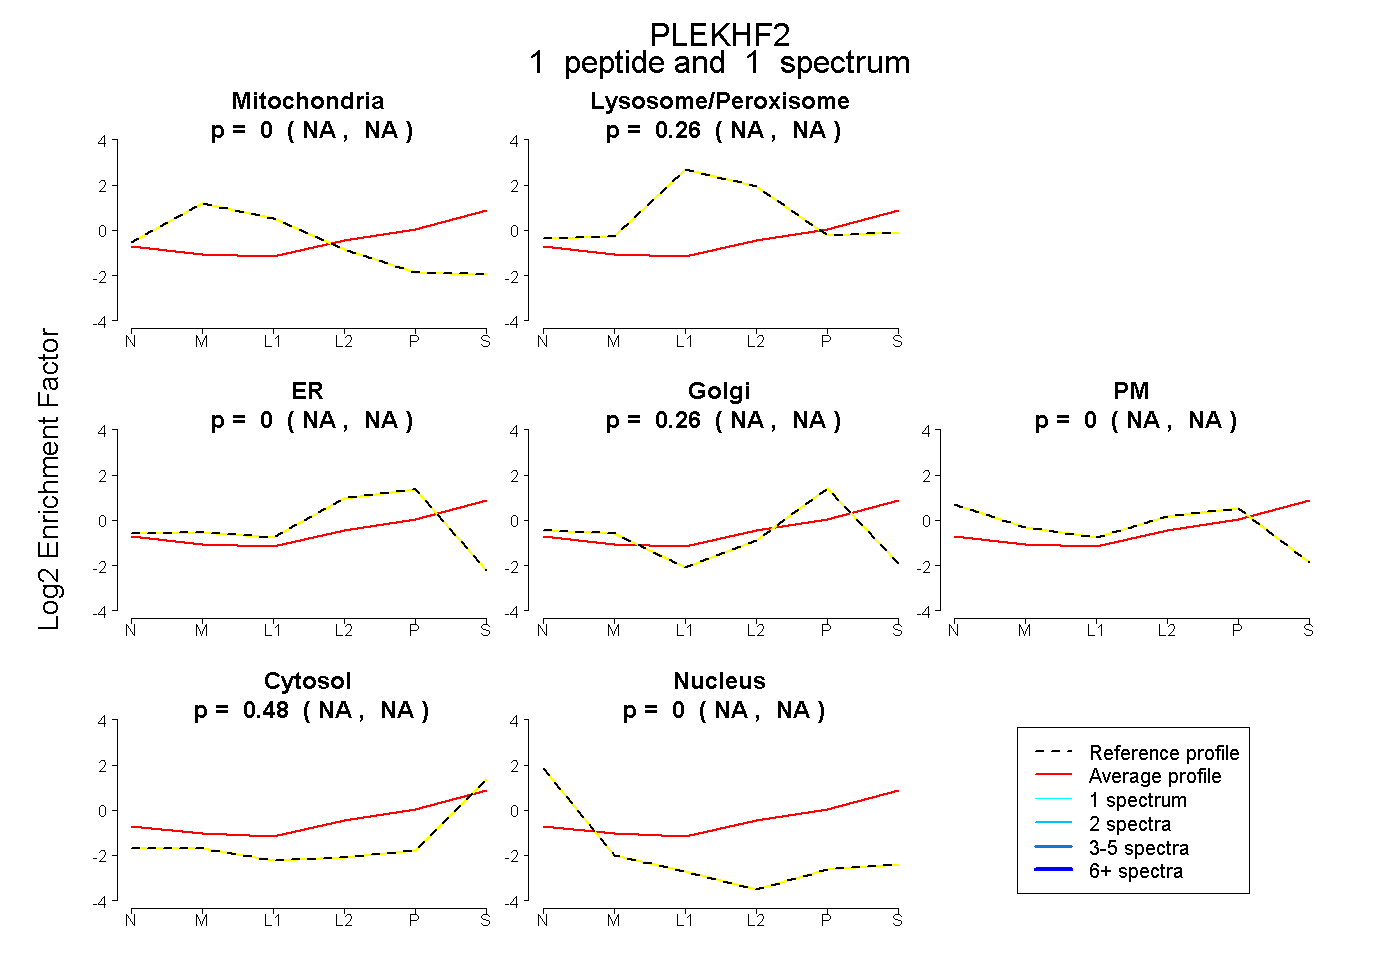 |
0.000 NA | NA |
0.260 NA | NA |
0.000 NA | NA |
0.262 NA | NA |
0.000 NA | NA |
0.478 NA | NA |
0.000 NA | NA |
|||
| Plot | Lyso | Other | |||||||||||
| Expt C |
4 peptides |
9 spectra |
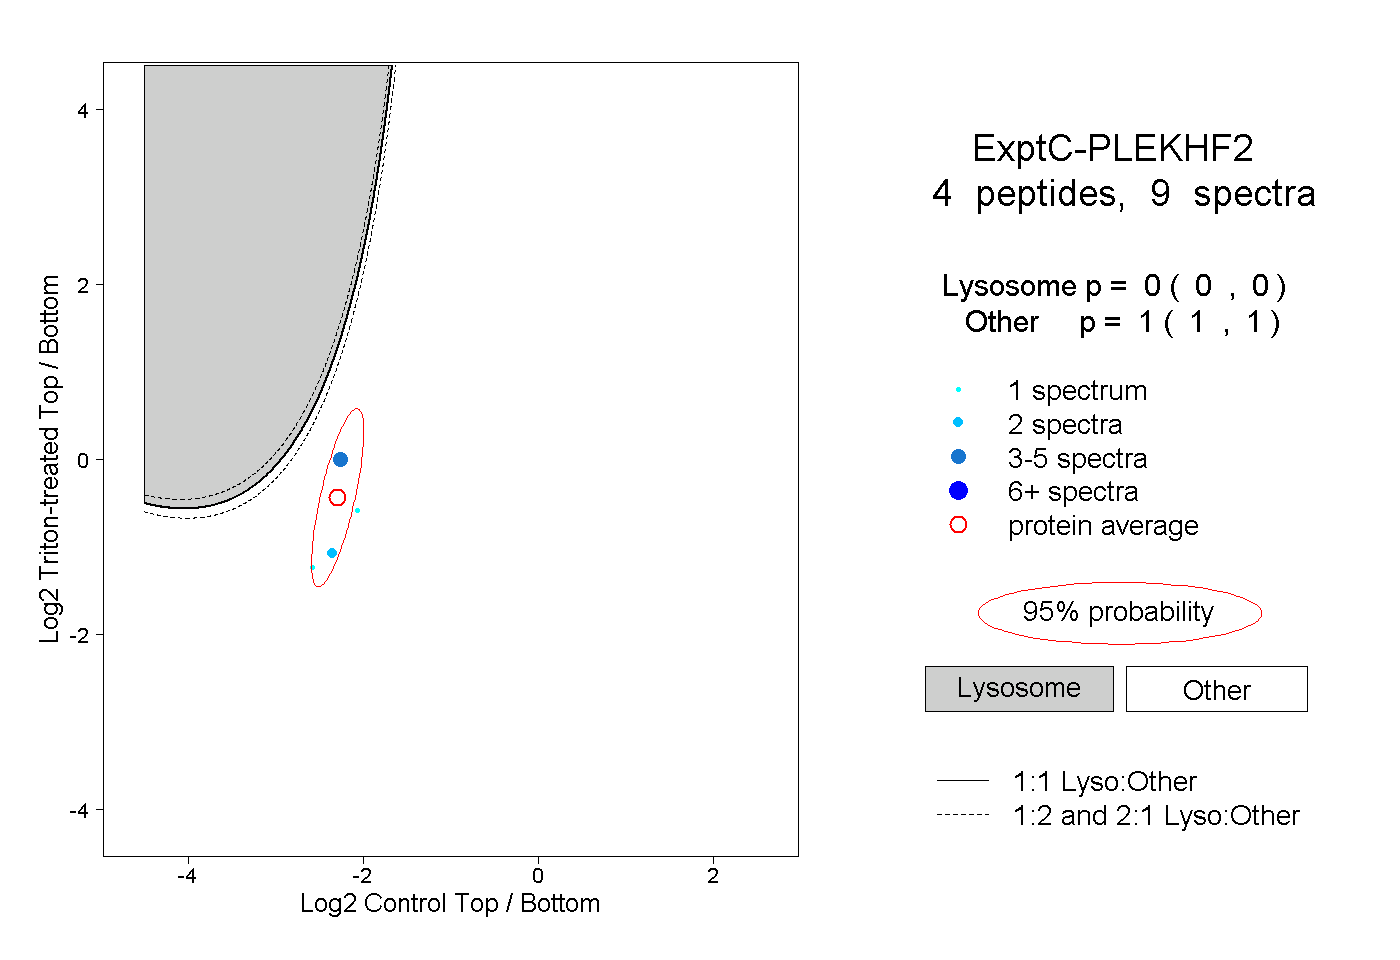 |
0.000 0.000 | 0.000 |
1.000 1.000 | 1.000 |