 10
10peptides
spectra
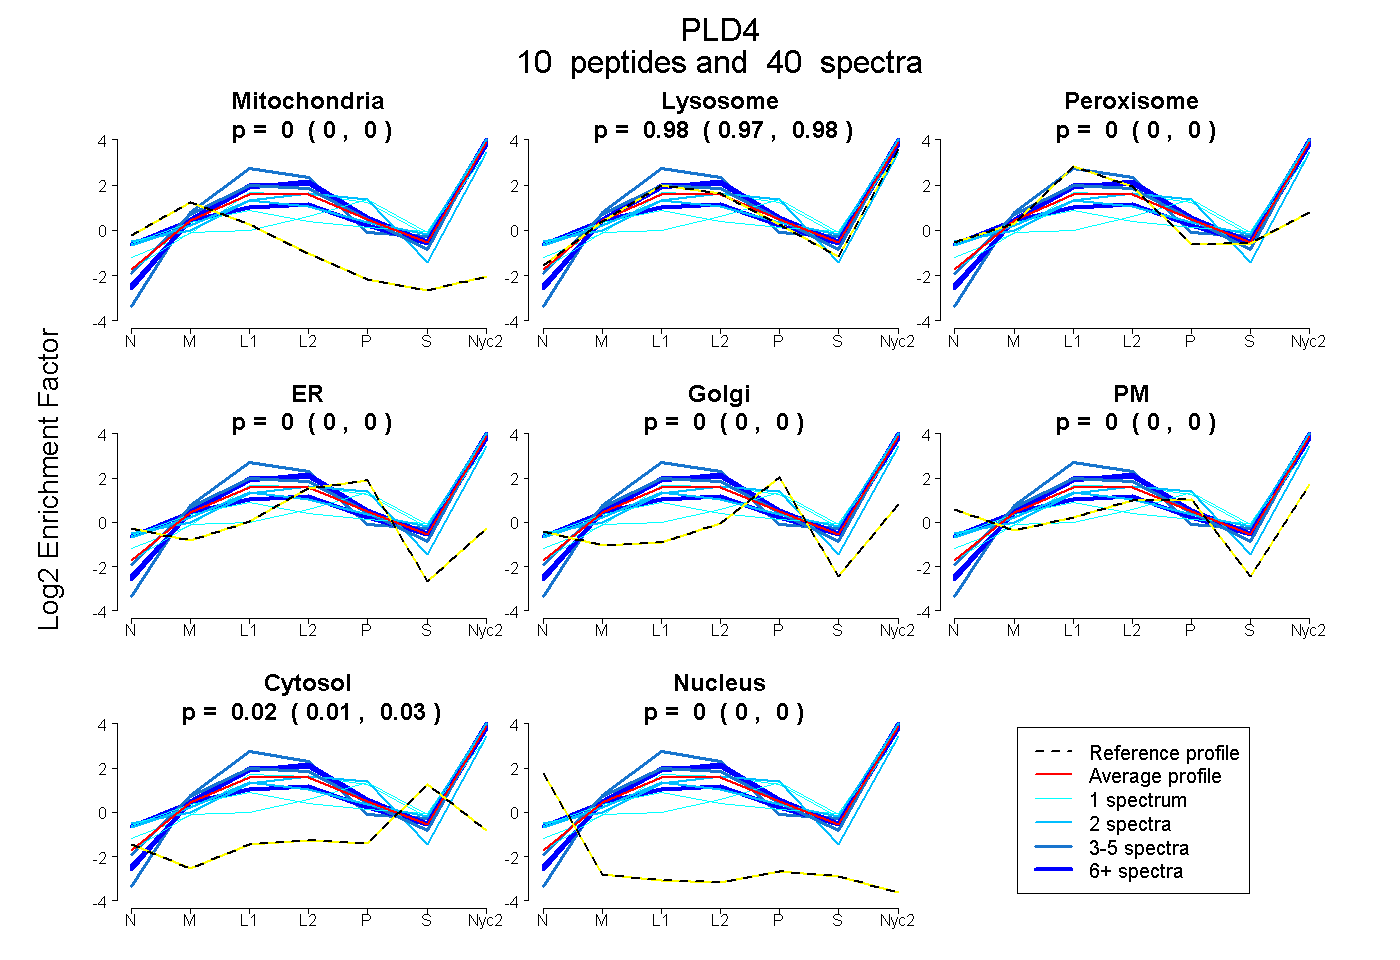
0.000 | 0.000
0.974 | 0.984
0.000 | 0.000
0.000 | 0.000
0.000 | 0.000
0.000 | 0.000
0.015 | 0.026
0.000 | 0.000
5peptides
spectra
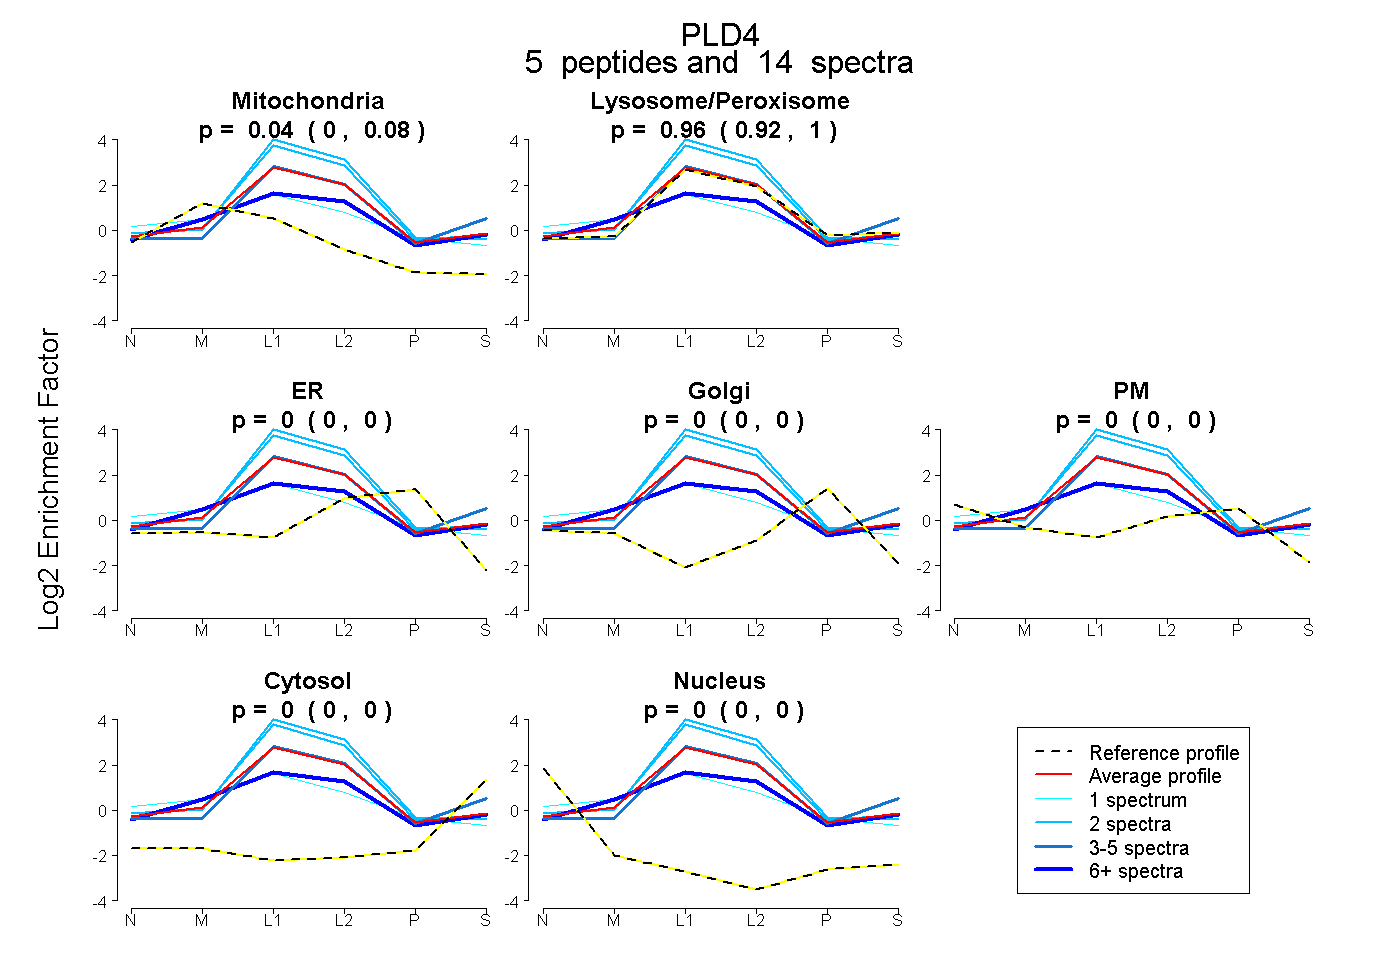
0.000 | 0.075
0.920 | 0.996
0.000 | 0.000
0.000 | 0.000
0.000 | 0.000
0.000 | 0.000
0.000 | 0.000
15peptides
spectra
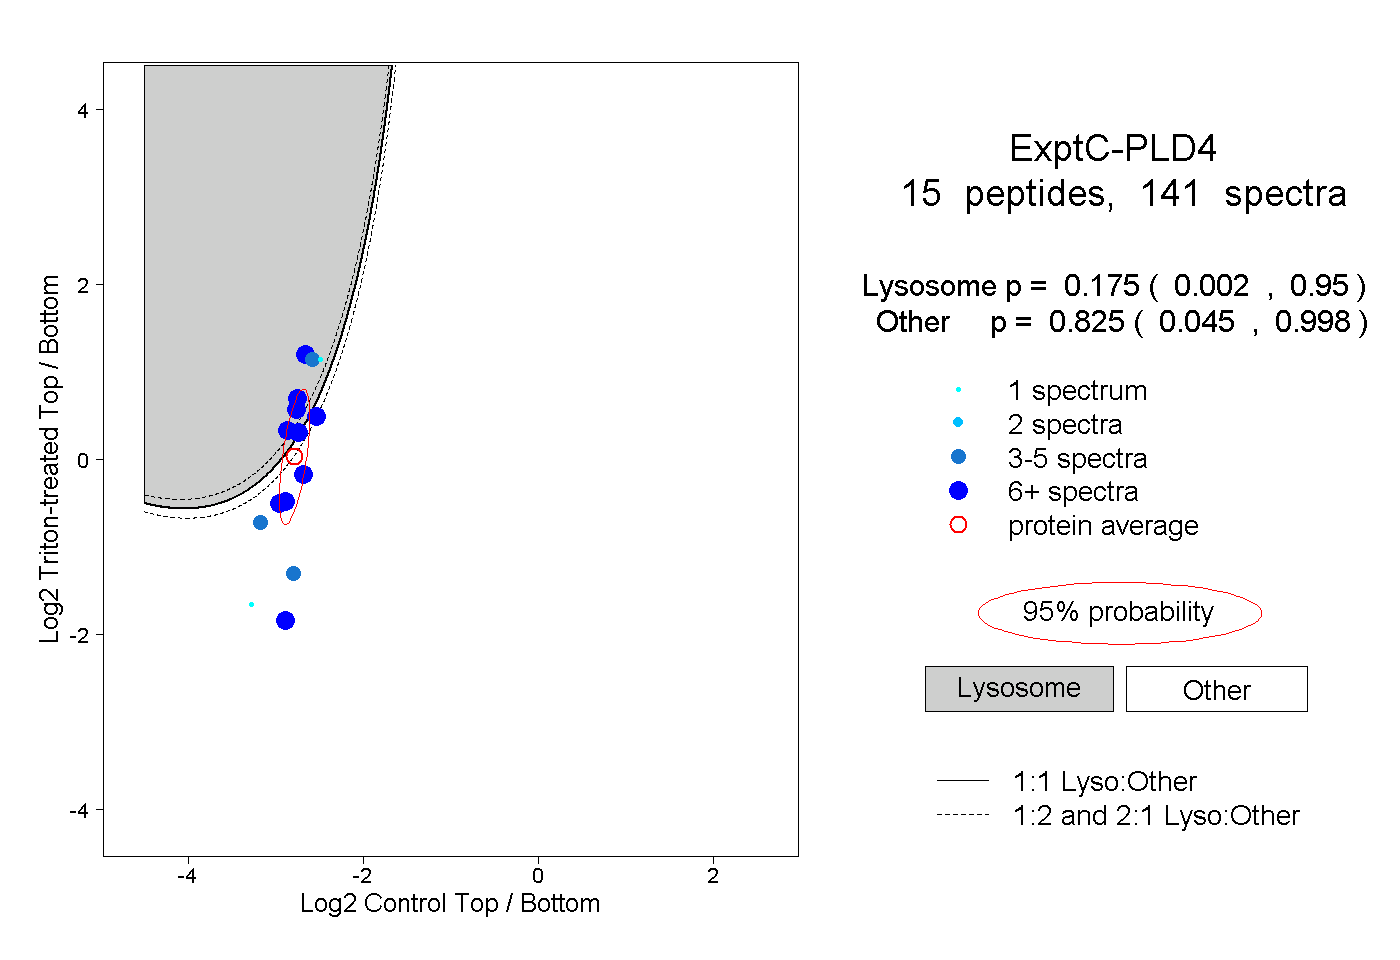
0.002 | 0.950
0.045 | 0.998
3peptides
spectra
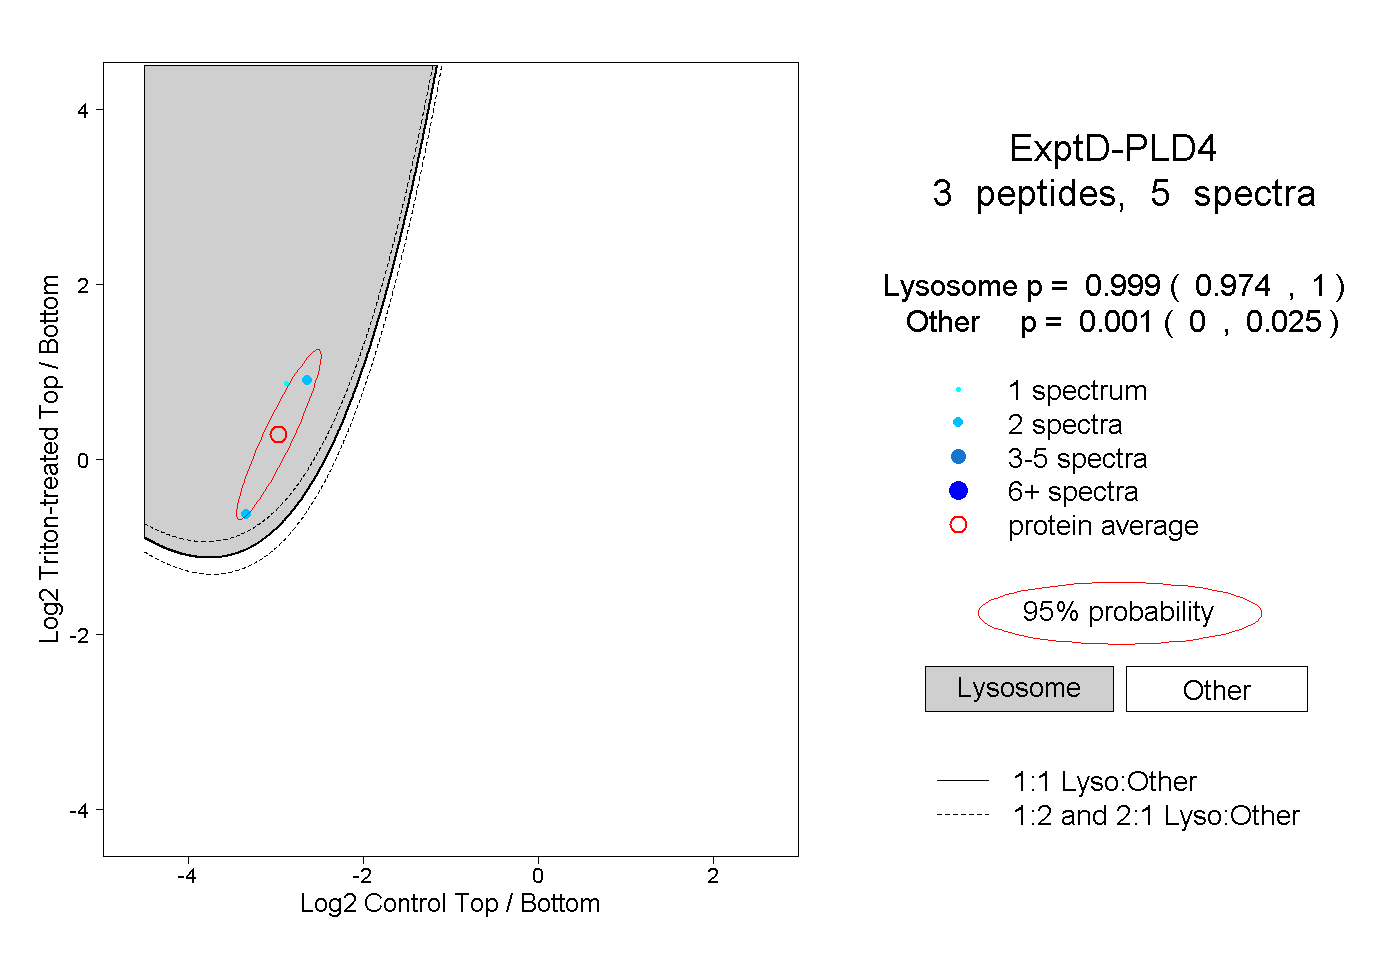
0.974 | 1.000
0.000 | 0.025