 10
10peptides
spectra
0.000 | 0.000
0.974 | 0.984
0.000 | 0.000
0.000 | 0.000
0.000 | 0.000
0.000 | 0.000
0.015 | 0.026
0.000 | 0.000
| Plot | Mito | Lyso | Perox | ER | Golgi | PM | Cytosol | Nucleus | |||||
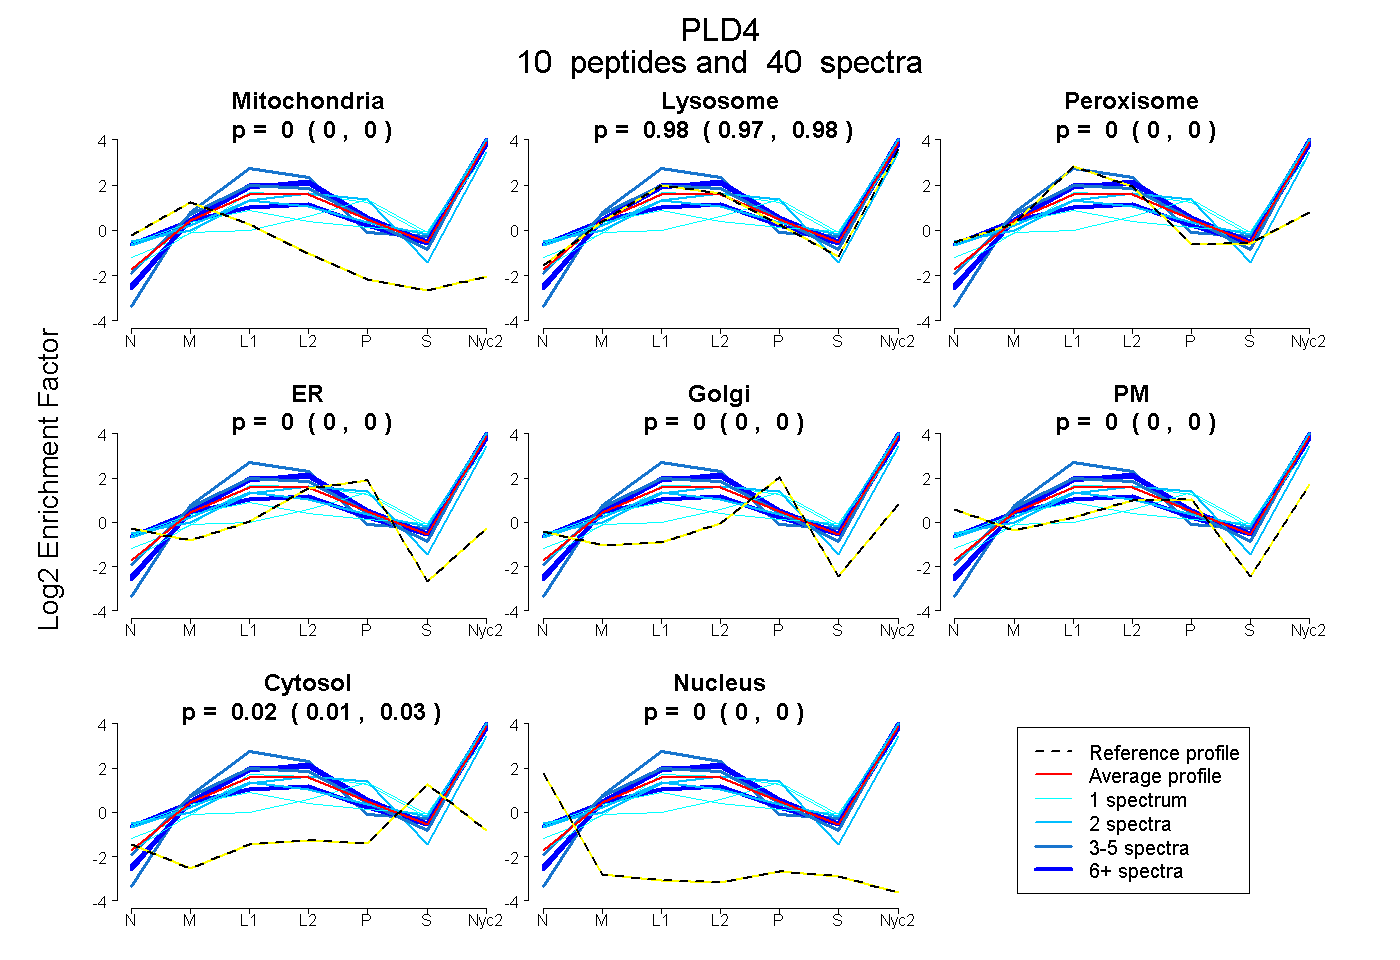
| Expt A |
10 peptides |
40 spectra |
|
0.000 0.000 | 0.000 |
0.979 0.974 | 0.984 |
0.000 0.000 | 0.000 |
0.000 0.000 | 0.000 |
0.000 0.000 | 0.000 |
0.000 0.000 | 0.000 |
0.021 0.015 | 0.026 |
0.000 0.000 | 0.000 |
| 1 spectrum, TPSAQPAVTTVQEQLR | 0.000 | 0.659 | 0.000 | 0.000 | 0.211 | 0.000 | 0.130 | 0.000 | ||
| 2 spectra, YWPVLDNALR | 0.000 | 0.897 | 0.000 | 0.000 | 0.000 | 0.025 | 0.078 | 0.000 | ||
| 3 spectra, QLTGGVLHSK | 0.000 | 1.000 | 0.000 | 0.000 | 0.000 | 0.000 | 0.000 | 0.000 | ||
| 6 spectra, FQQLLLR | 0.000 | 1.000 | 0.000 | 0.000 | 0.000 | 0.000 | 0.000 | 0.000 | ||
| 1 spectrum, AAAFNK | 0.000 | 0.949 | 0.000 | 0.000 | 0.049 | 0.000 | 0.002 | 0.000 | ||
| 9 spectra, FTHPAR | 0.000 | 0.817 | 0.000 | 0.000 | 0.000 | 0.125 | 0.058 | 0.000 | ||
| 3 spectra, FMVTDK | 0.000 | 1.000 | 0.000 | 0.000 | 0.000 | 0.000 | 0.000 | 0.000 | ||
| 12 spectra, FWVVDGR | 0.000 | 1.000 | 0.000 | 0.000 | 0.000 | 0.000 | 0.000 | 0.000 | ||
| 2 spectra, HVYVGSANMDWR | 0.000 | 0.641 | 0.000 | 0.000 | 0.000 | 0.359 | 0.000 | 0.000 | ||
| 1 spectrum, SLSQVK | 0.000 | 0.811 | 0.000 | 0.000 | 0.000 | 0.035 | 0.154 | 0.000 |
| Plot | Mito | Lyso or Perox | ER | Golgi | PM | Cytosol | Nucleus | ||||||
| Expt B |
5 peptides |
14 spectra |
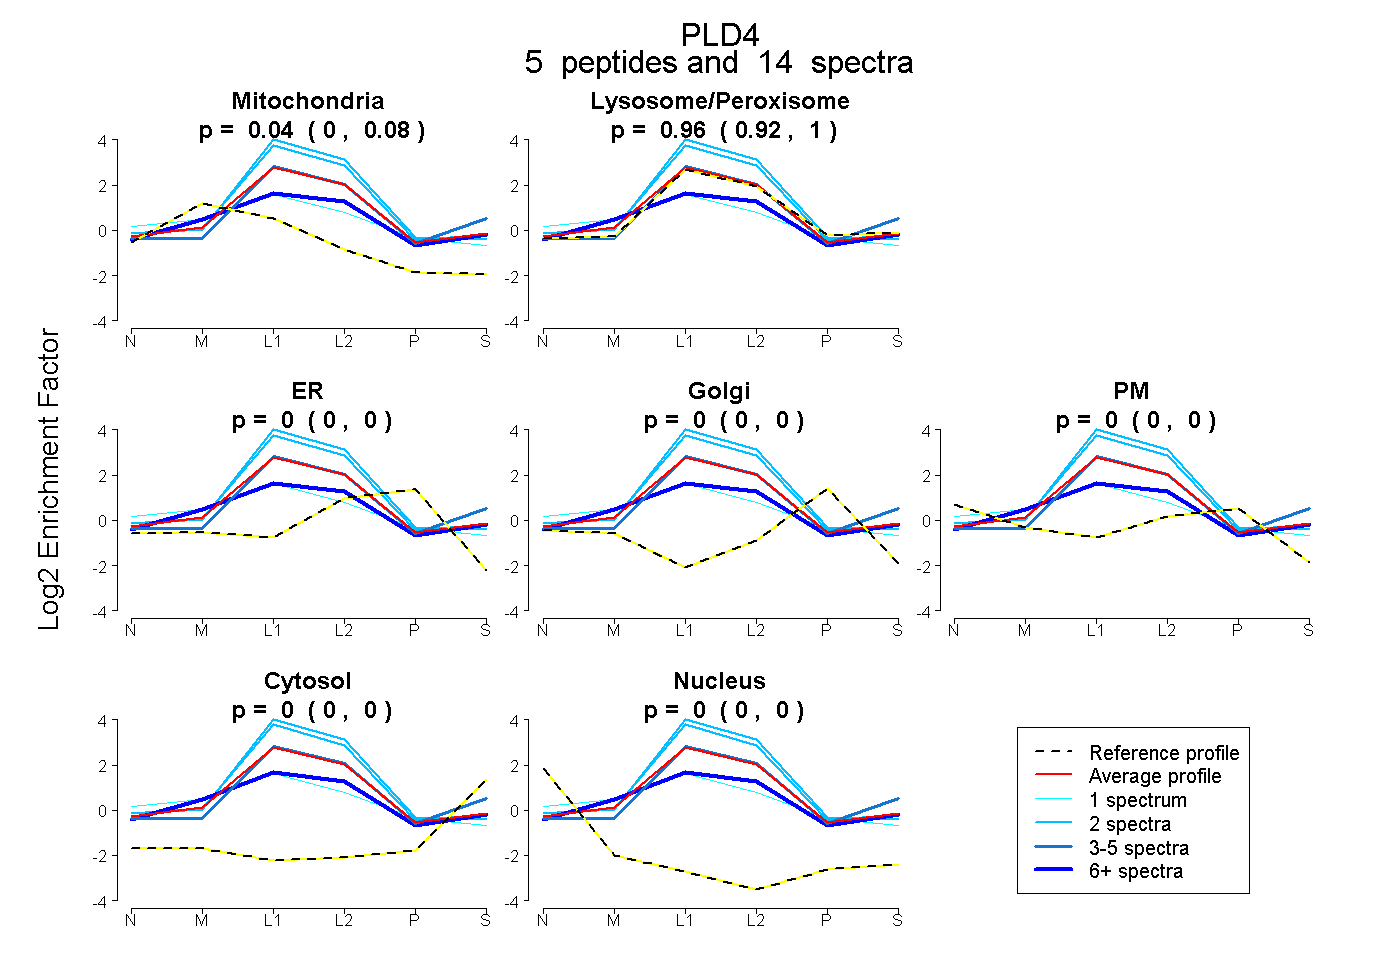 |
0.039 0.000 | 0.075 |
0.961 0.920 | 0.996 |
0.000 0.000 | 0.000 |
0.000 0.000 | 0.000 |
0.000 0.000 | 0.000 |
0.000 0.000 | 0.000 |
0.000 0.000 | 0.000 |
|||
| Plot | Lyso | Other | |||||||||||
| Expt C |
15 peptides |
141 spectra |
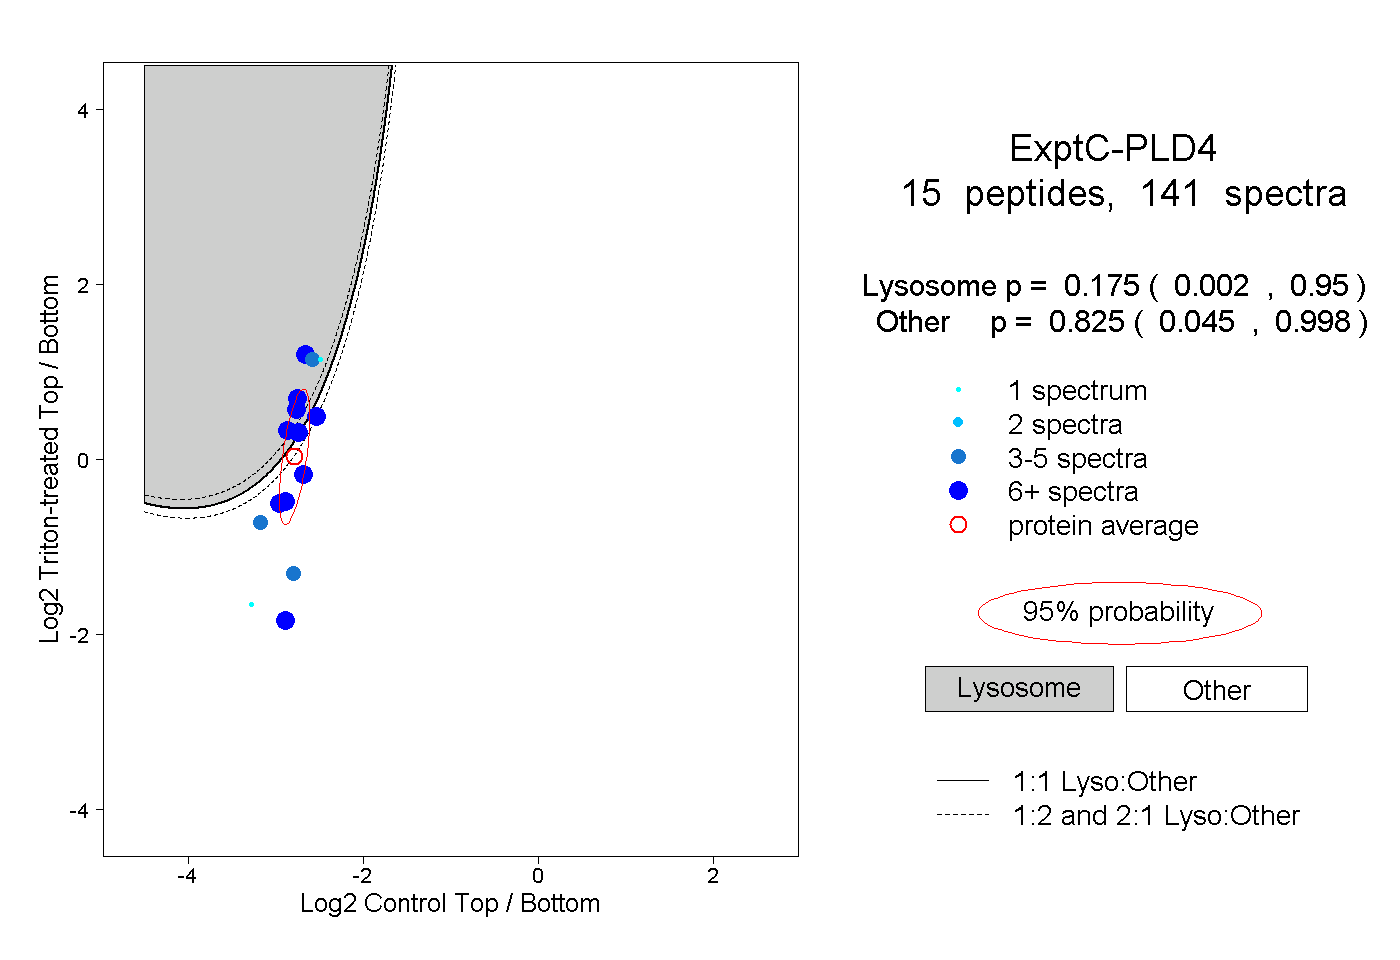 |
0.175 0.002 | 0.950 |
0.825 0.045 | 0.998 |
||||||||
| Plot | Lyso | Other | |||||||||||
| Expt D |
3 peptides |
5 spectra |
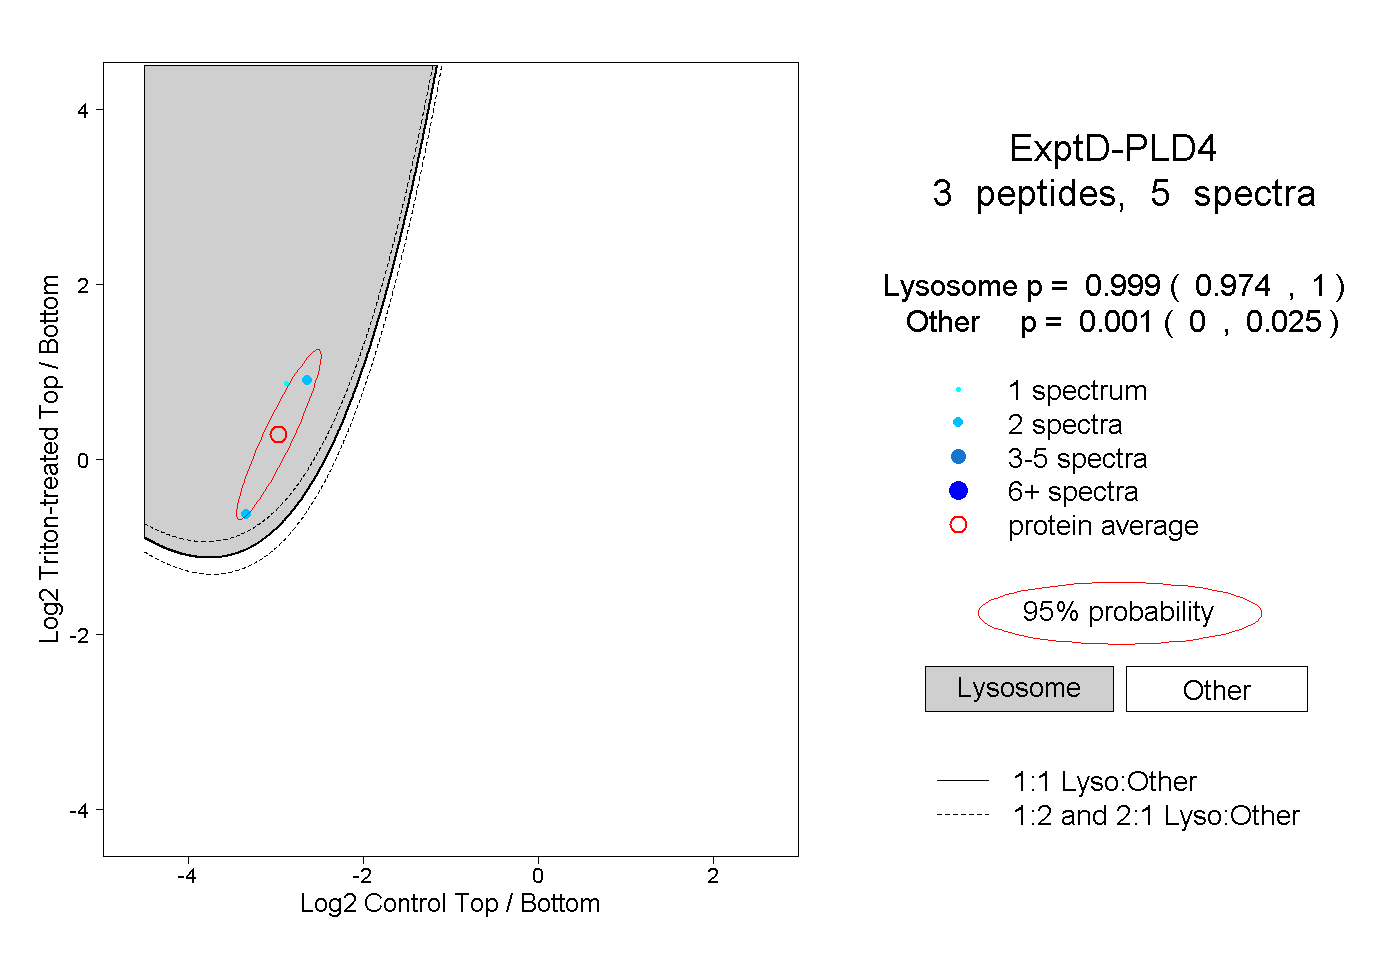 |
0.999 0.974 | 1.000 |
0.001 0.000 | 0.025 |