 6
6peptides
spectra
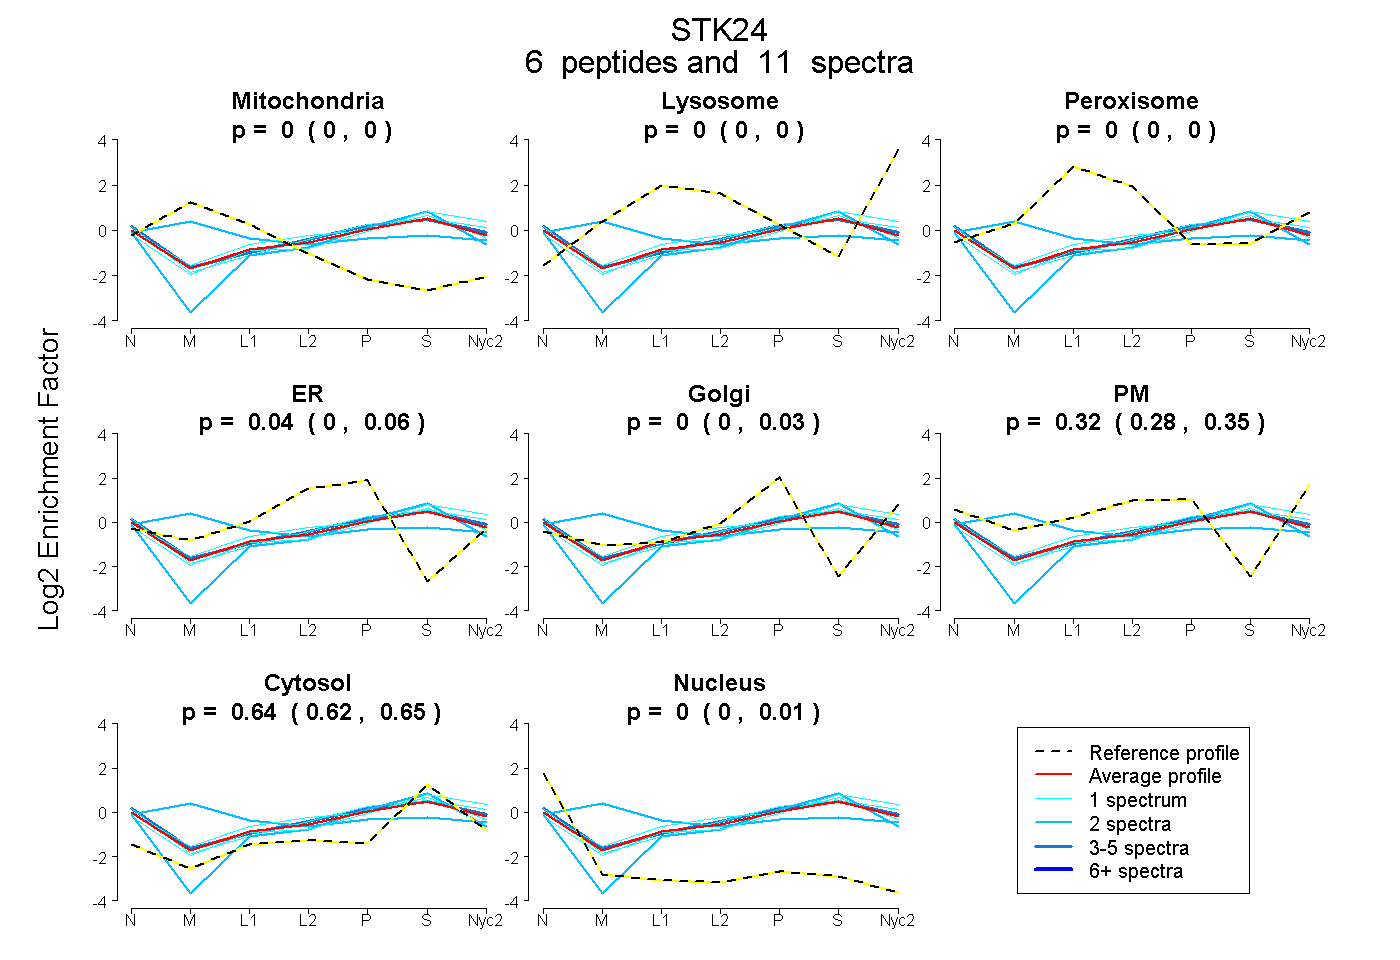
0.000 | 0.000
0.000 | 0.000
0.000 | 0.000
0.000 | 0.061
0.000 | 0.030
0.275 | 0.354
0.617 | 0.655
0.000 | 0.009
4peptides
spectra
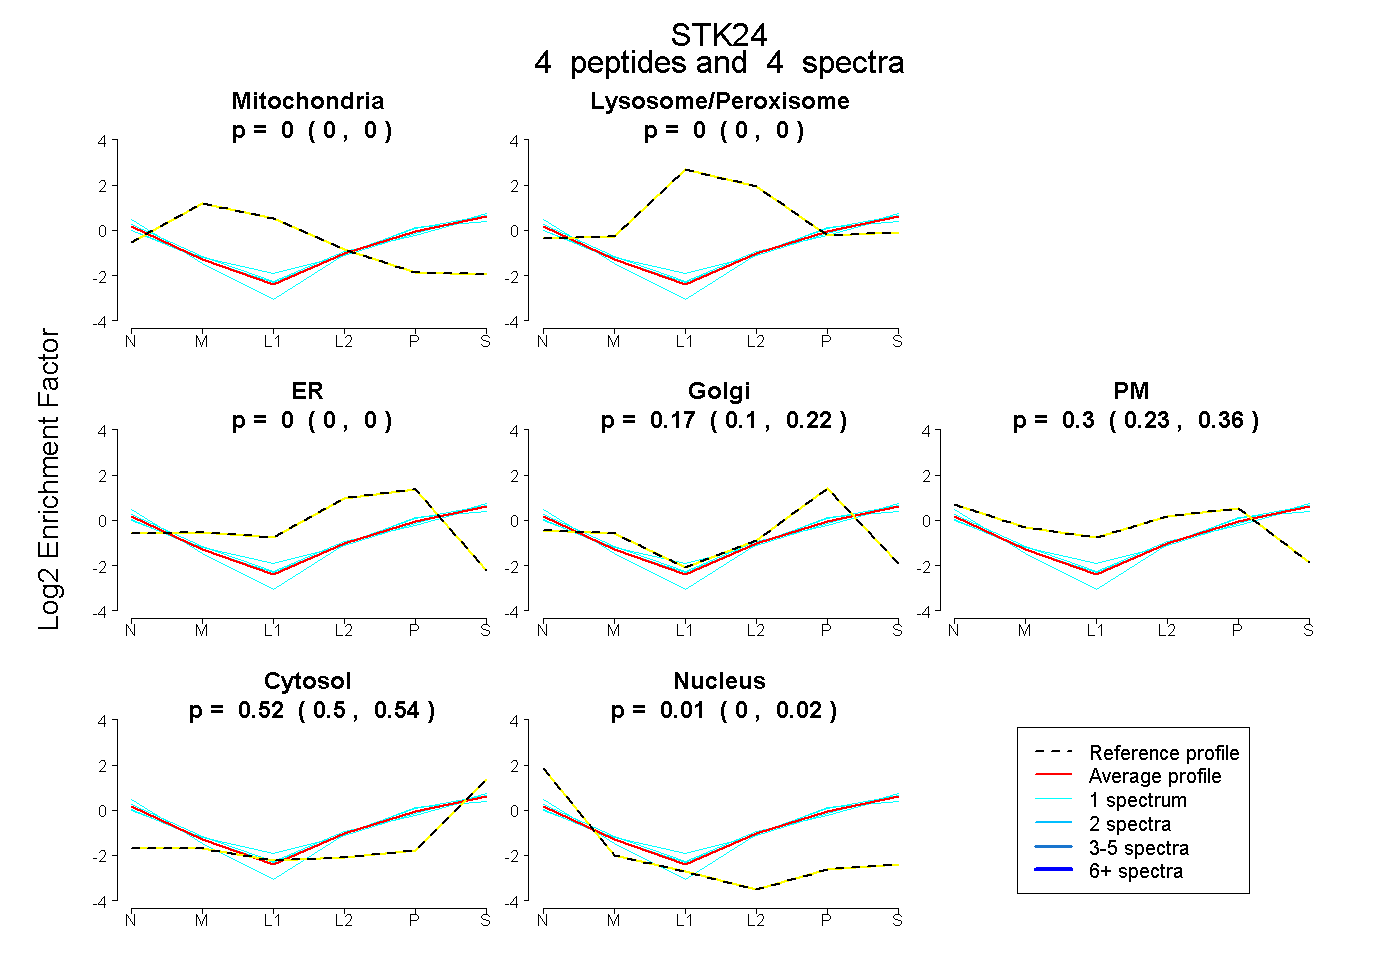
0.000 | 0.000
0.000 | 0.000
0.000 | 0.000
0.104 | 0.224
0.229 | 0.357
0.503 | 0.537
0.000 | 0.022
10peptides
spectra
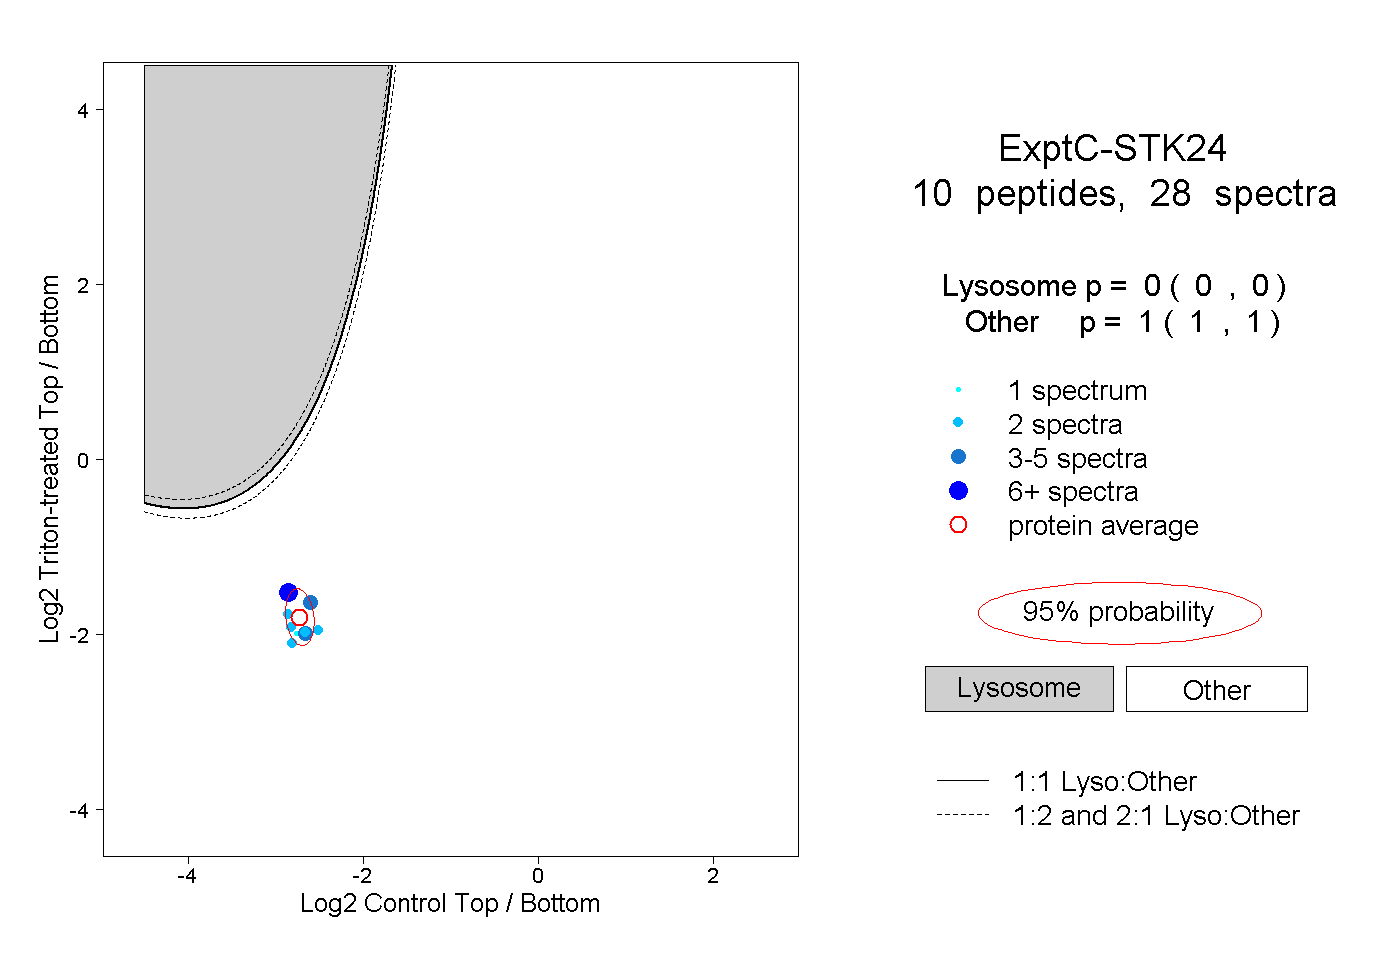
0.000 | 0.000
1.000 | 1.000