 6
6peptides
spectra
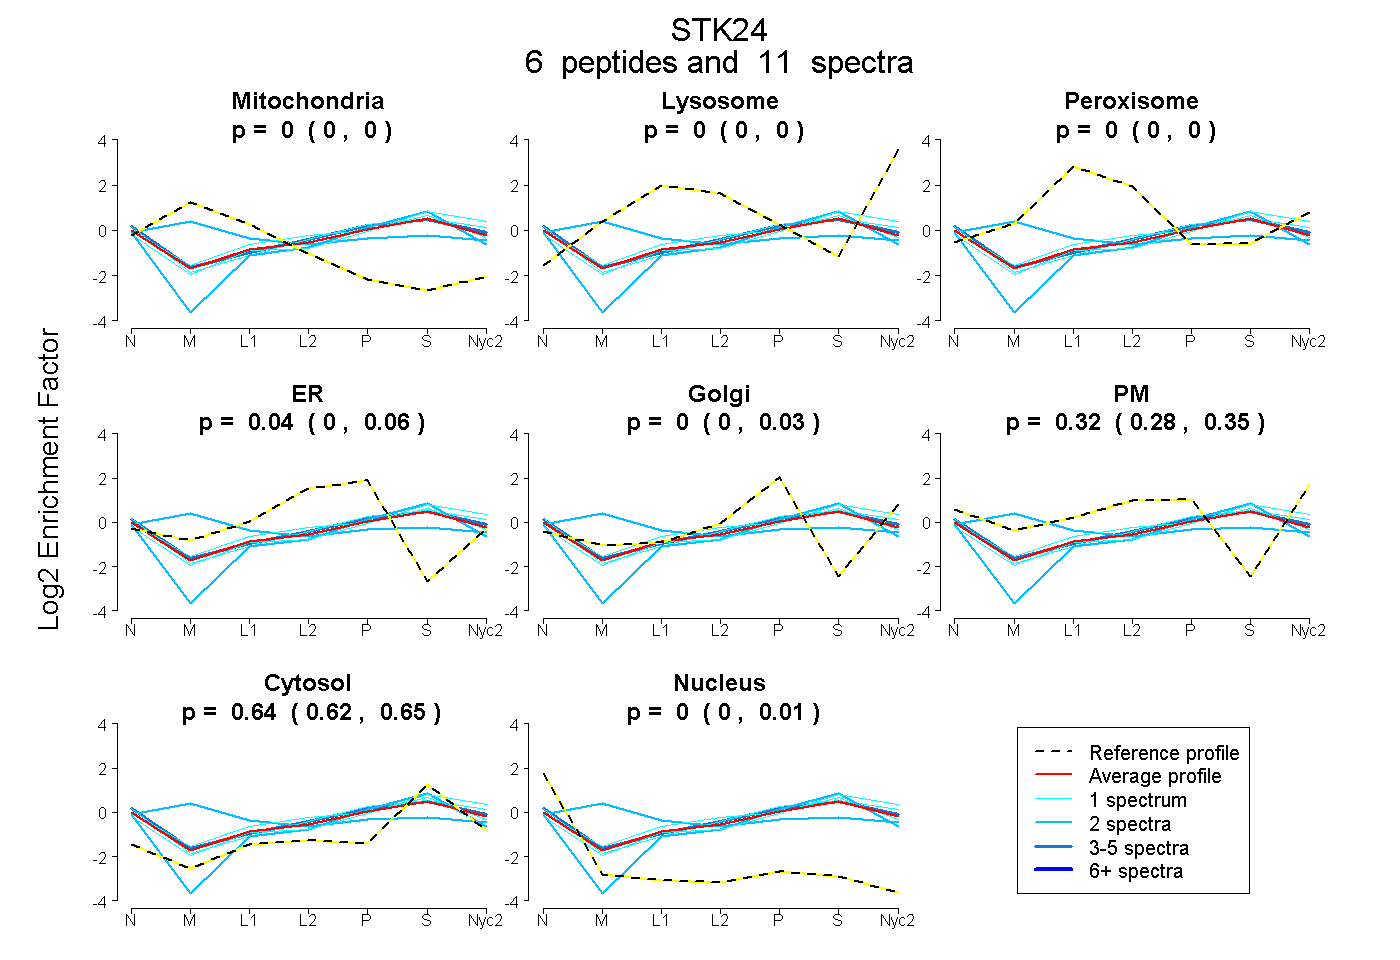
0.000 | 0.000
0.000 | 0.000
0.000 | 0.000
0.000 | 0.061
0.000 | 0.030
0.275 | 0.354
0.617 | 0.655
0.000 | 0.009
| Plot | Mito | Lyso | Perox | ER | Golgi | PM | Cytosol | Nucleus | |||||
| Expt A |
6 peptides |
11 spectra |
|
0.000 0.000 | 0.000 |
0.000 0.000 | 0.000 |
0.000 0.000 | 0.000 |
0.039 0.000 | 0.061 |
0.000 0.000 | 0.030 |
0.320 0.275 | 0.354 |
0.641 0.617 | 0.655 |
0.000 0.000 | 0.009 |
| 2 spectra, GSFGEVFK | 0.302 | 0.000 | 0.120 | 0.000 | 0.087 | 0.165 | 0.327 | 0.000 | ||
| 4 spectra, ADPEELFTK | 0.000 | 0.000 | 0.000 | 0.022 | 0.032 | 0.341 | 0.605 | 0.000 | ||
| 1 spectrum, YYGSYLK | 0.000 | 0.000 | 0.000 | 0.000 | 0.000 | 0.321 | 0.679 | 0.000 | ||
| 1 spectrum, NNPPTLEGSYSRPLK | 0.000 | 0.000 | 0.000 | 0.000 | 0.074 | 0.319 | 0.607 | 0.000 | ||
| 1 spectrum, NLENGTLQPSDLER | 0.000 | 0.000 | 0.067 | 0.080 | 0.000 | 0.238 | 0.615 | 0.000 | ||
| 2 spectra, SQACGGNLGSIEELR | 0.000 | 0.000 | 0.000 | 0.082 | 0.137 | 0.000 | 0.760 | 0.021 |
| Plot | Mito | Lyso or Perox | ER | Golgi | PM | Cytosol | Nucleus | ||||||
| Expt B |
4 peptides |
4 spectra |
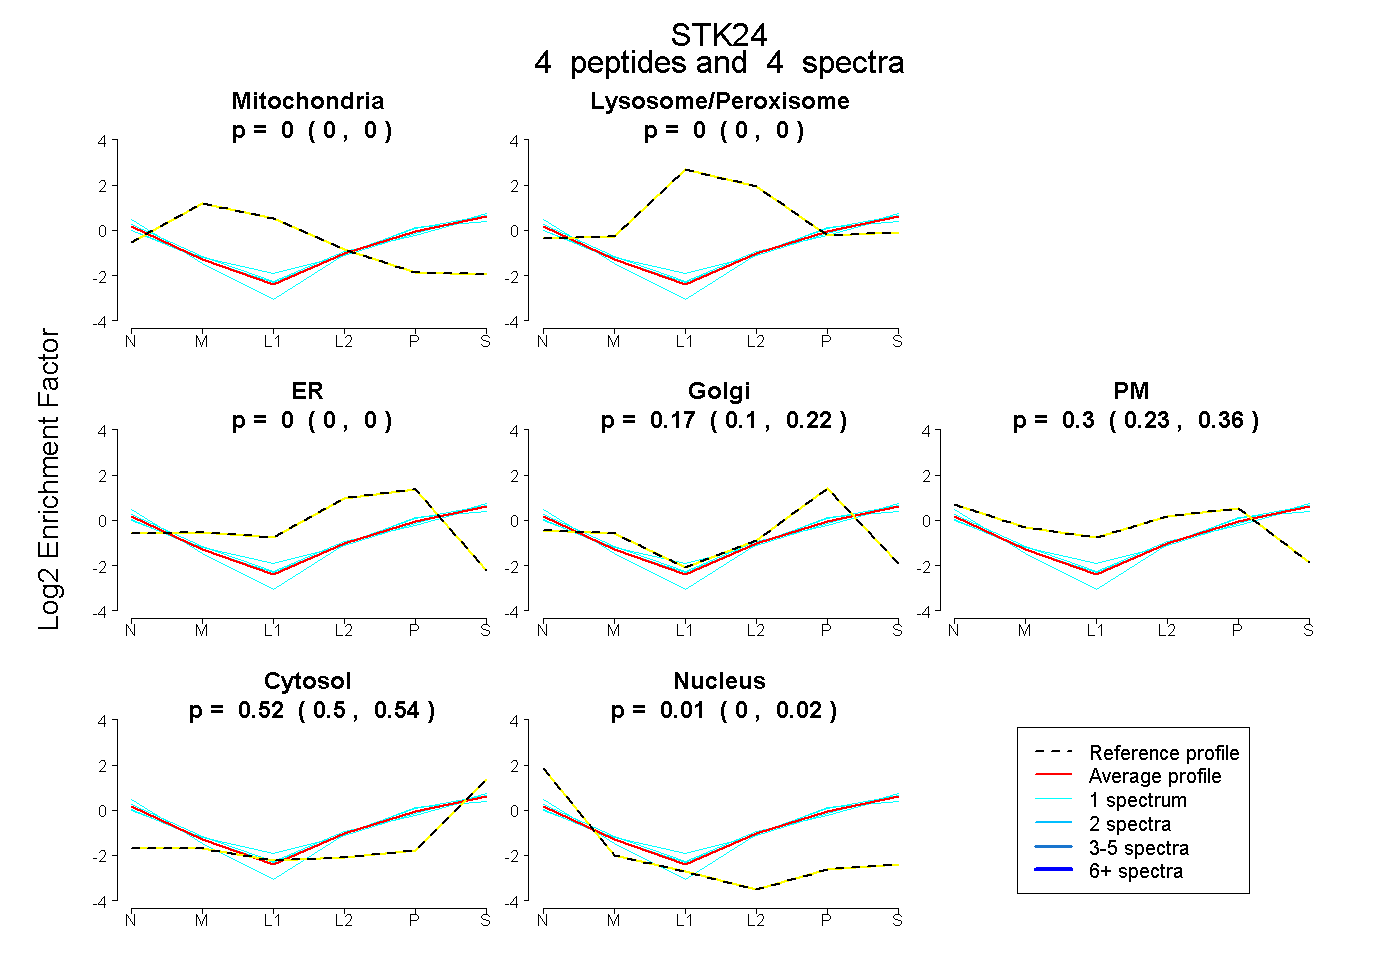 |
0.000 0.000 | 0.000 |
0.000 0.000 | 0.000 |
0.000 0.000 | 0.000 |
0.170 0.104 | 0.224 |
0.302 0.229 | 0.357 |
0.523 0.503 | 0.537 |
0.006 0.000 | 0.022 |
|||
| Plot | Lyso | Other | |||||||||||
| Expt C |
10 peptides |
28 spectra |
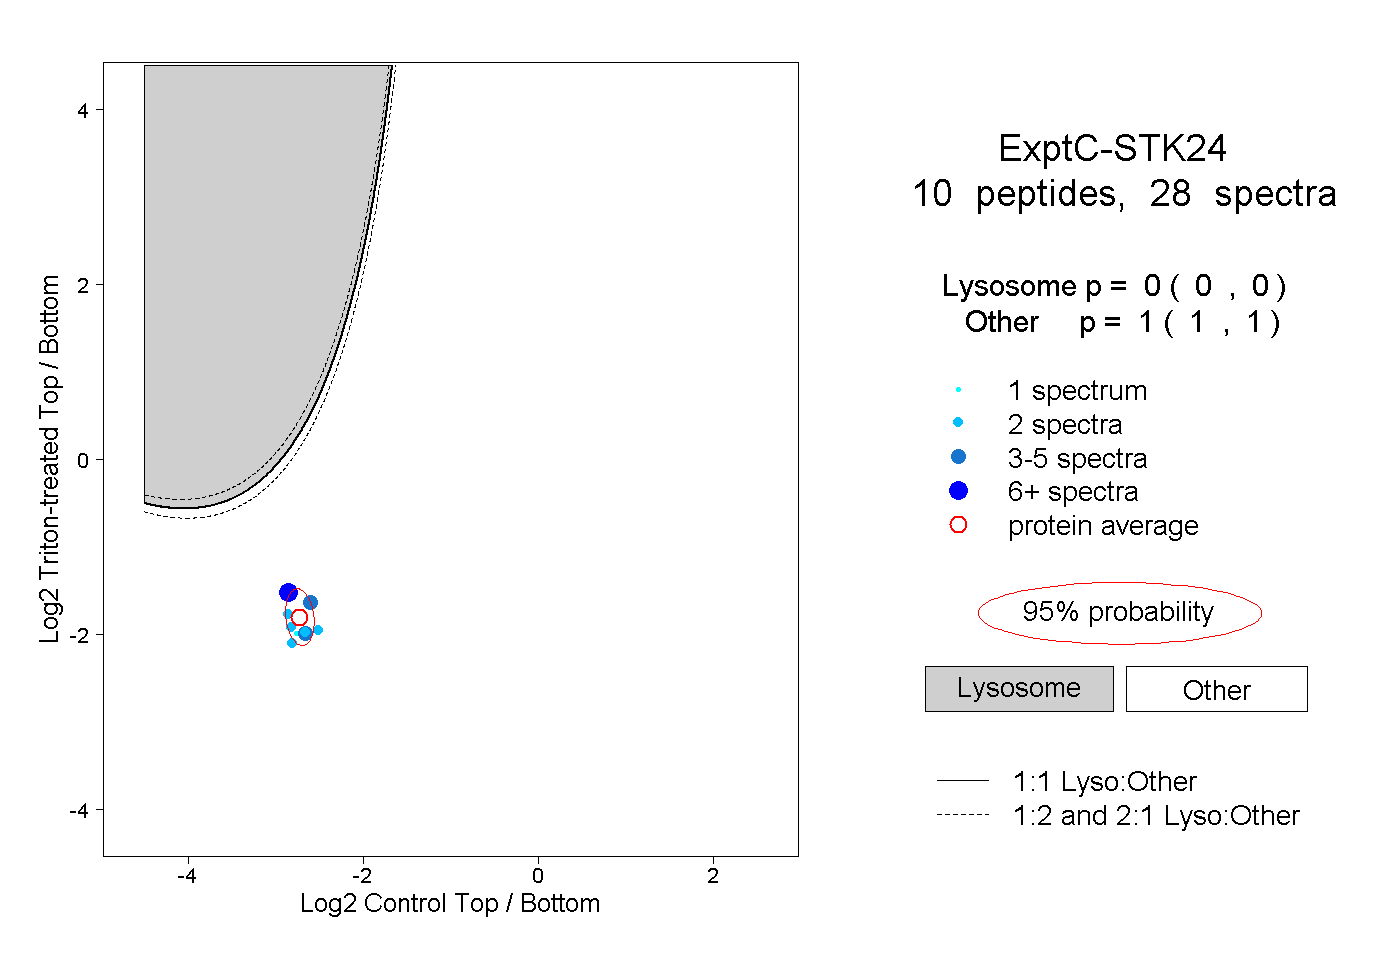 |
0.000 0.000 | 0.000 |
1.000 1.000 | 1.000 |