 3
3peptides
spectra
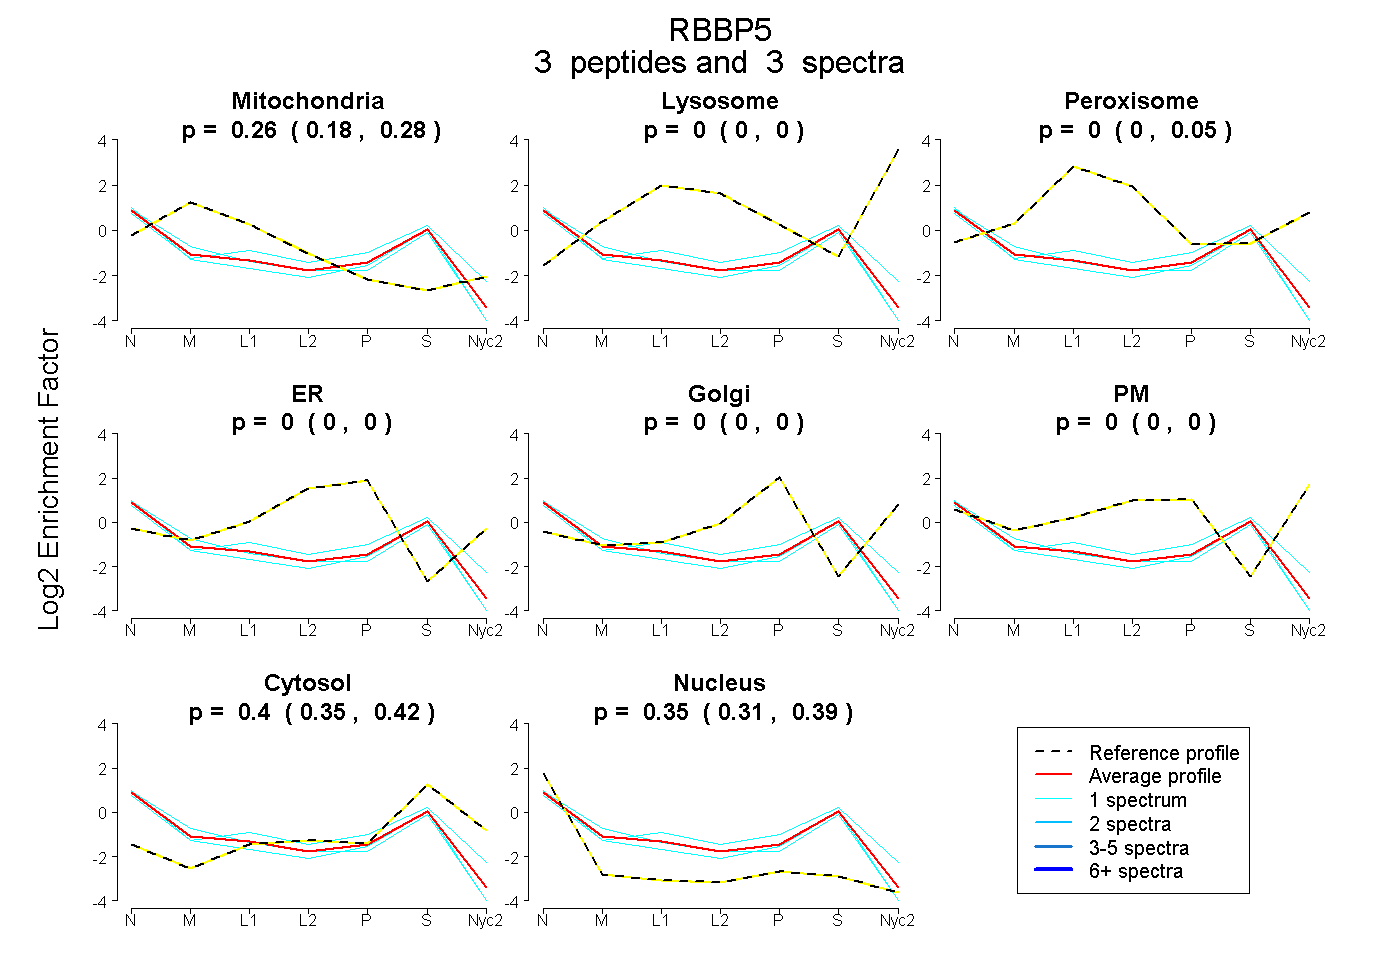
0.177 | 0.283
0.000 | 0.000
0.000 | 0.055
0.000 | 0.000
0.000 | 0.000
0.000 | 0.000
0.350 | 0.423
0.312 | 0.392
1peptide
spectrum
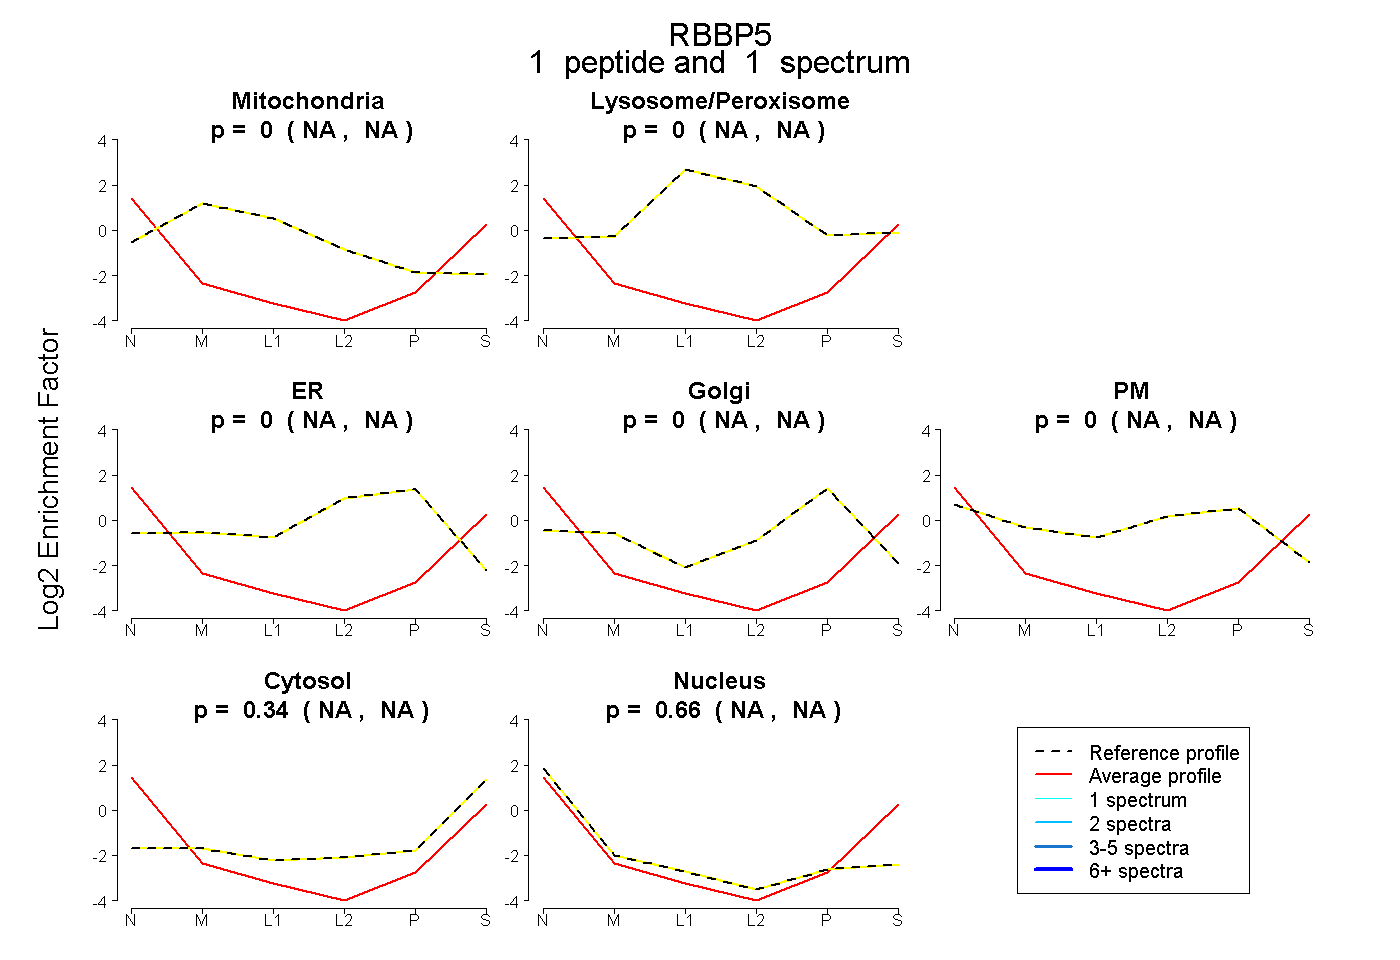
NA | NA
NA | NA
NA | NA
NA | NA
NA | NA
NA | NA
NA | NA
1peptide
spectrum
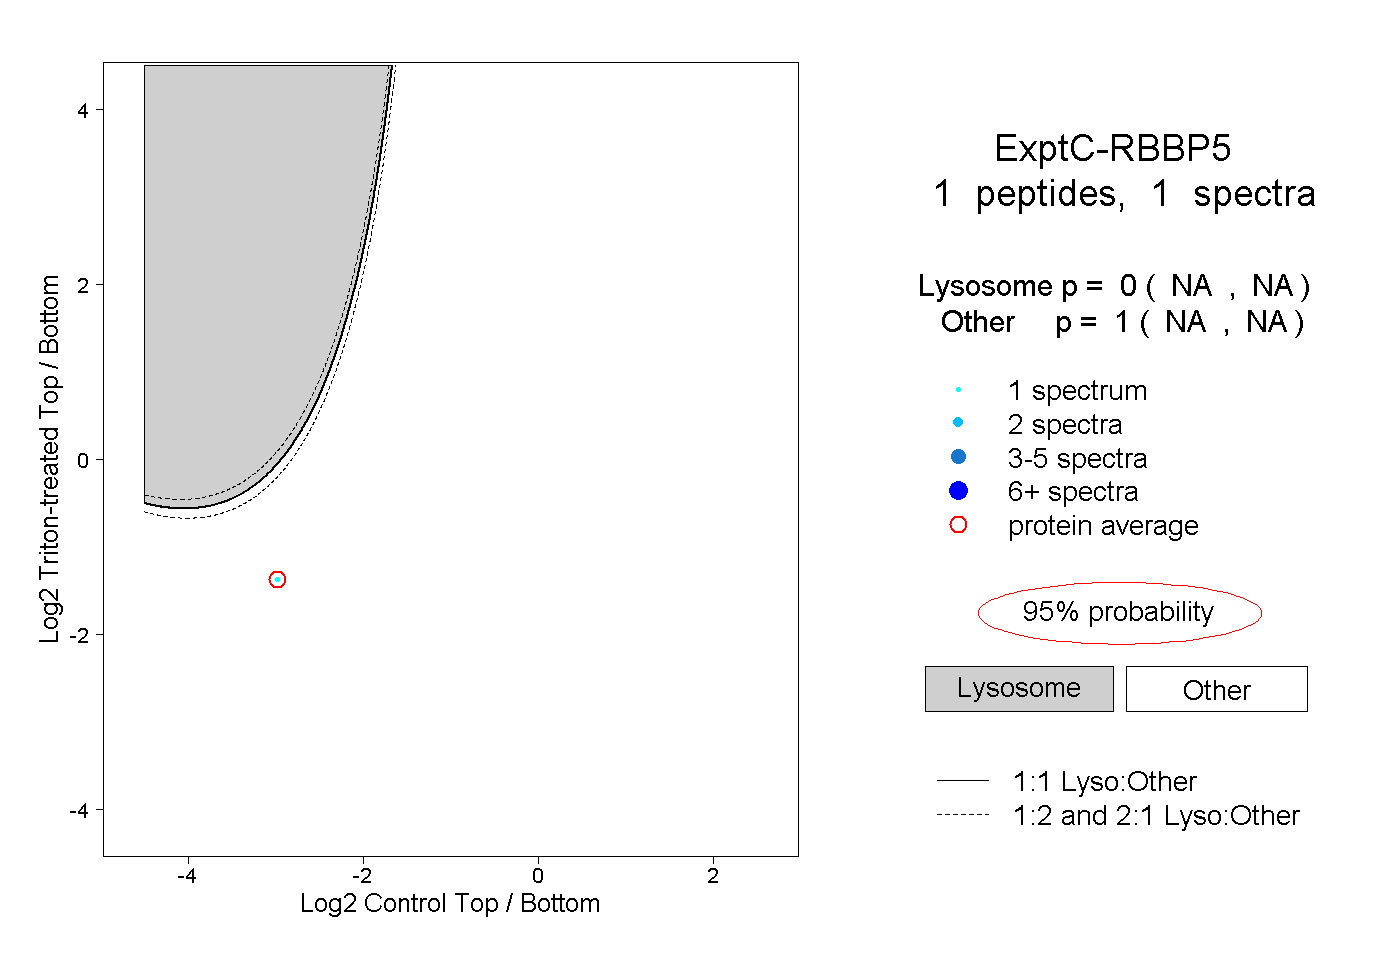
NA | NA
NA | NA
1peptide
spectrum
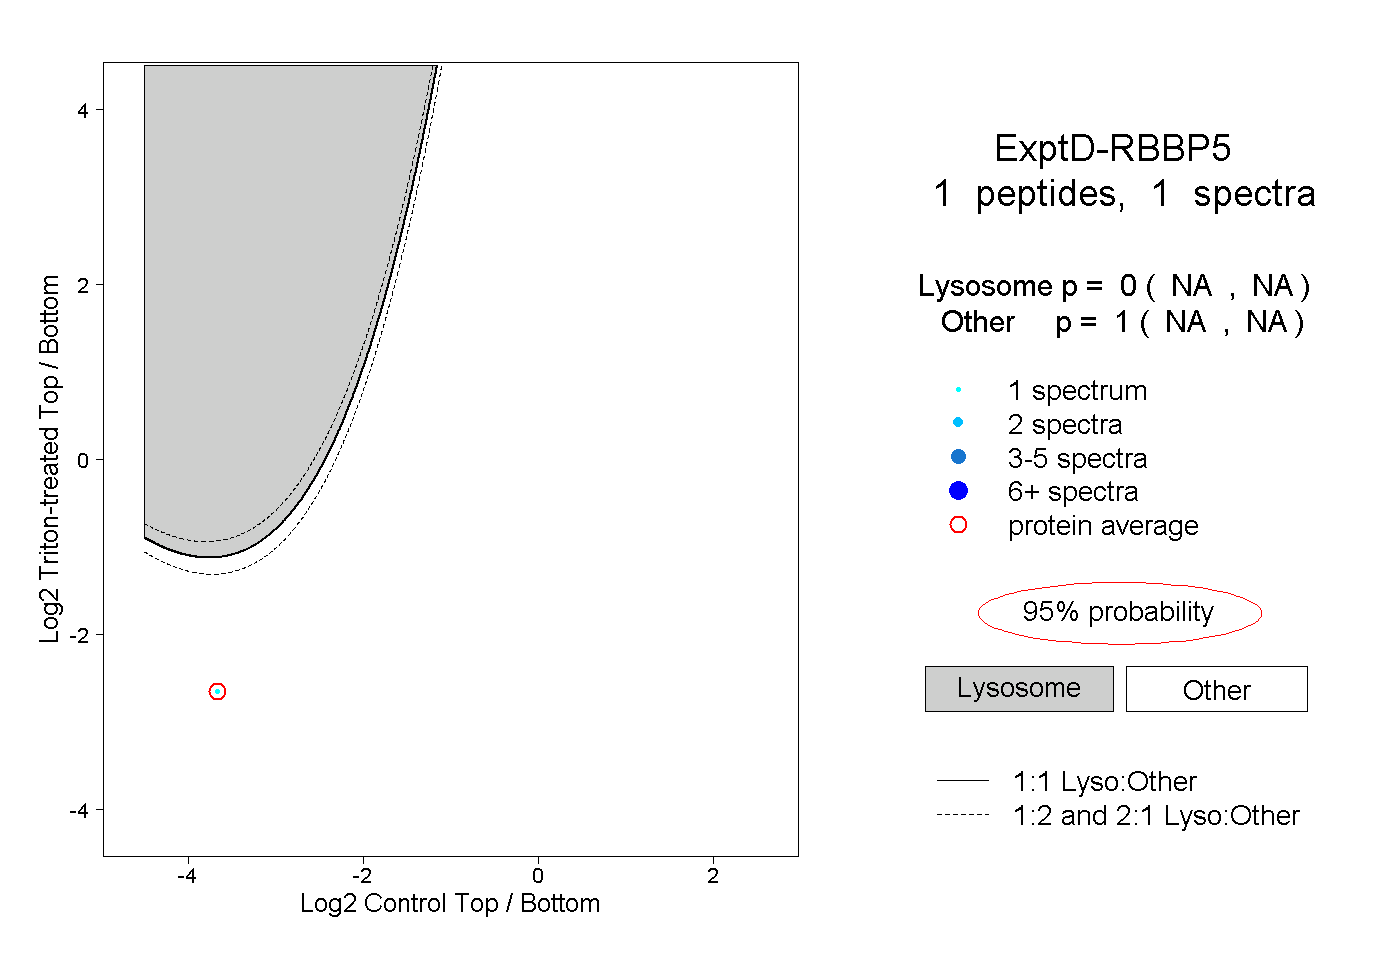
NA | NA
NA | NA