 3
3peptides
spectra
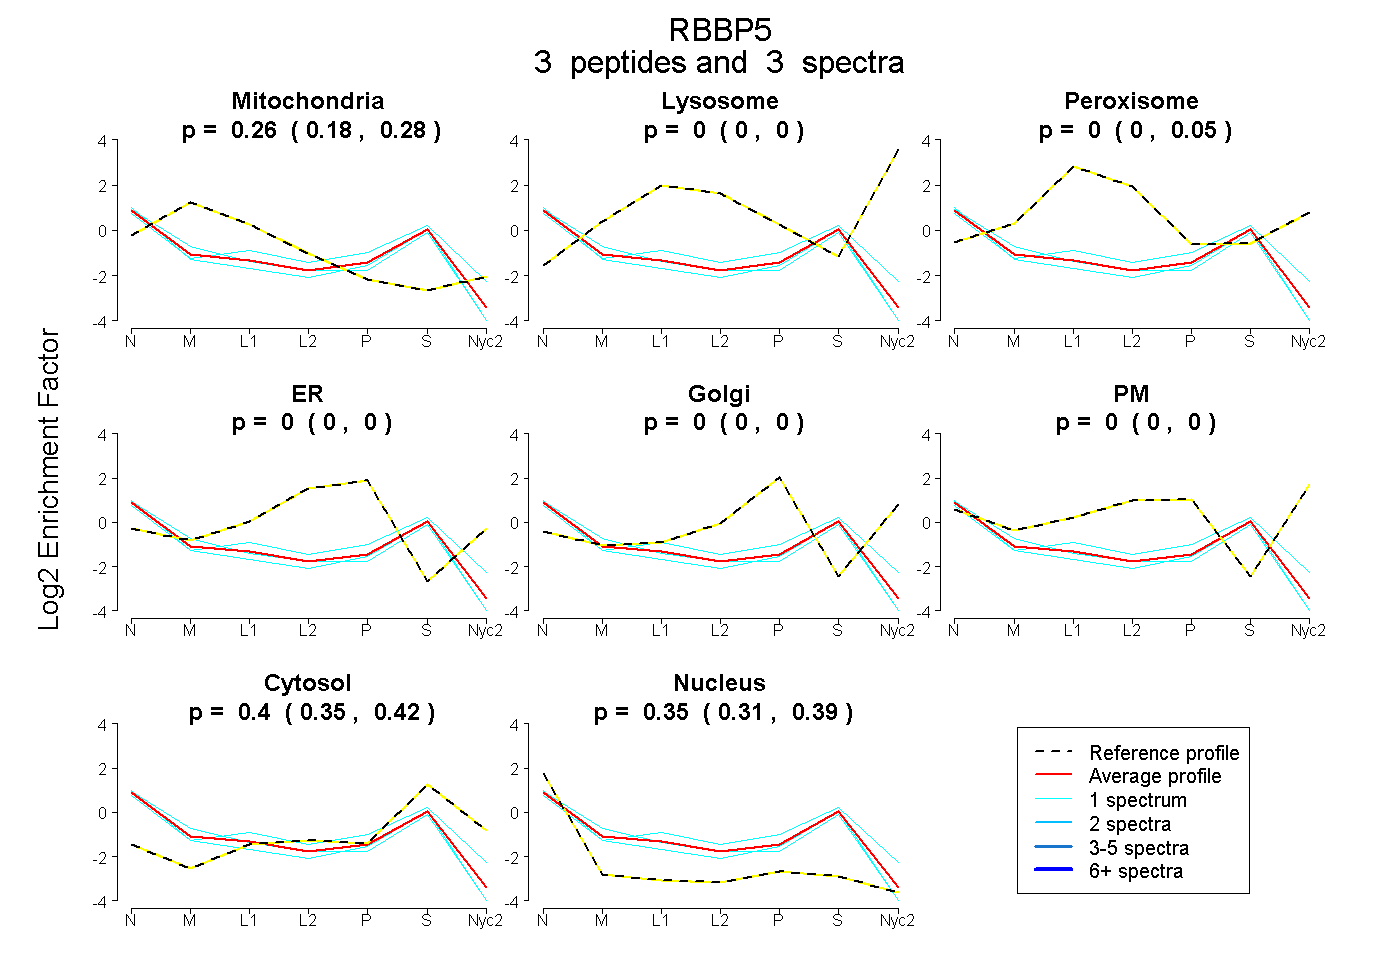
0.177 | 0.283
0.000 | 0.000
0.000 | 0.055
0.000 | 0.000
0.000 | 0.000
0.000 | 0.000
0.350 | 0.423
0.312 | 0.392
| Plot | Mito | Lyso | Perox | ER | Golgi | PM | Cytosol | Nucleus | |||||
| Expt A |
3 peptides |
3 spectra |
|
0.256 0.177 | 0.283 |
0.000 0.000 | 0.000 |
0.000 0.000 | 0.055 |
0.000 0.000 | 0.000 |
0.000 0.000 | 0.000 |
0.000 0.000 | 0.000 |
0.399 0.350 | 0.423 |
0.345 0.312 | 0.392 |
| 1 spectrum, IVIWDFLTR | 0.181 | 0.000 | 0.000 | 0.000 | 0.000 | 0.000 | 0.359 | 0.460 | ||
| 1 spectrum, TDSQDLVASFR | 0.063 | 0.000 | 0.197 | 0.000 | 0.000 | 0.000 | 0.410 | 0.330 | ||
| 1 spectrum, EILTCGR | 0.313 | 0.000 | 0.000 | 0.000 | 0.000 | 0.000 | 0.303 | 0.383 |
| Plot | Mito | Lyso or Perox | ER | Golgi | PM | Cytosol | Nucleus | ||||||
| Expt B |
1 peptide |
1 spectrum |
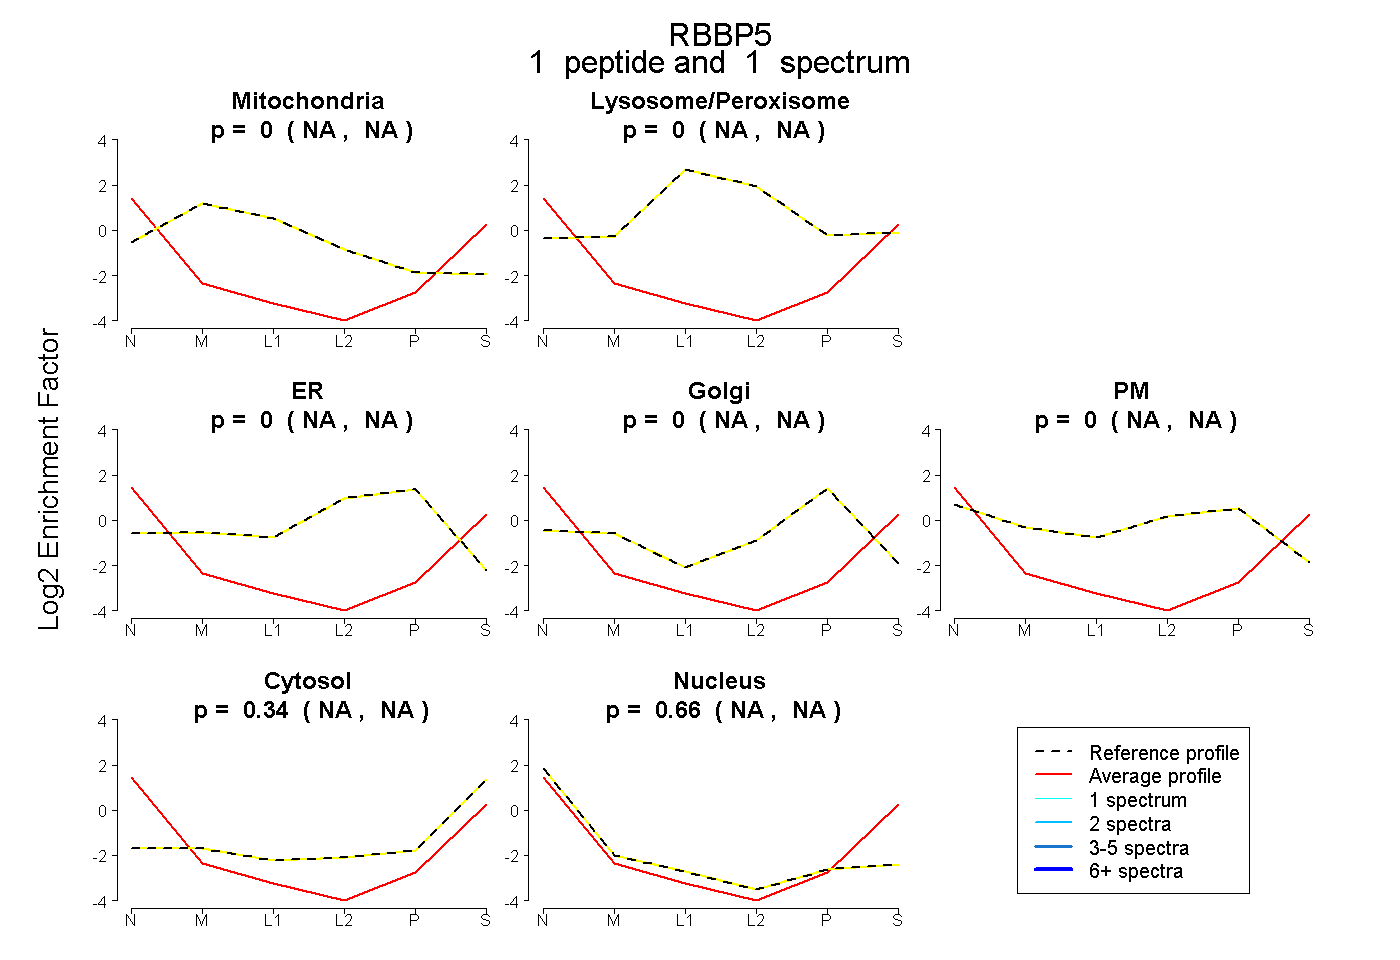 |
0.000 NA | NA |
0.000 NA | NA |
0.000 NA | NA |
0.000 NA | NA |
0.000 NA | NA |
0.343 NA | NA |
0.657 NA | NA |
|||
| Plot | Lyso | Other | |||||||||||
| Expt C |
1 peptide |
1 spectrum |
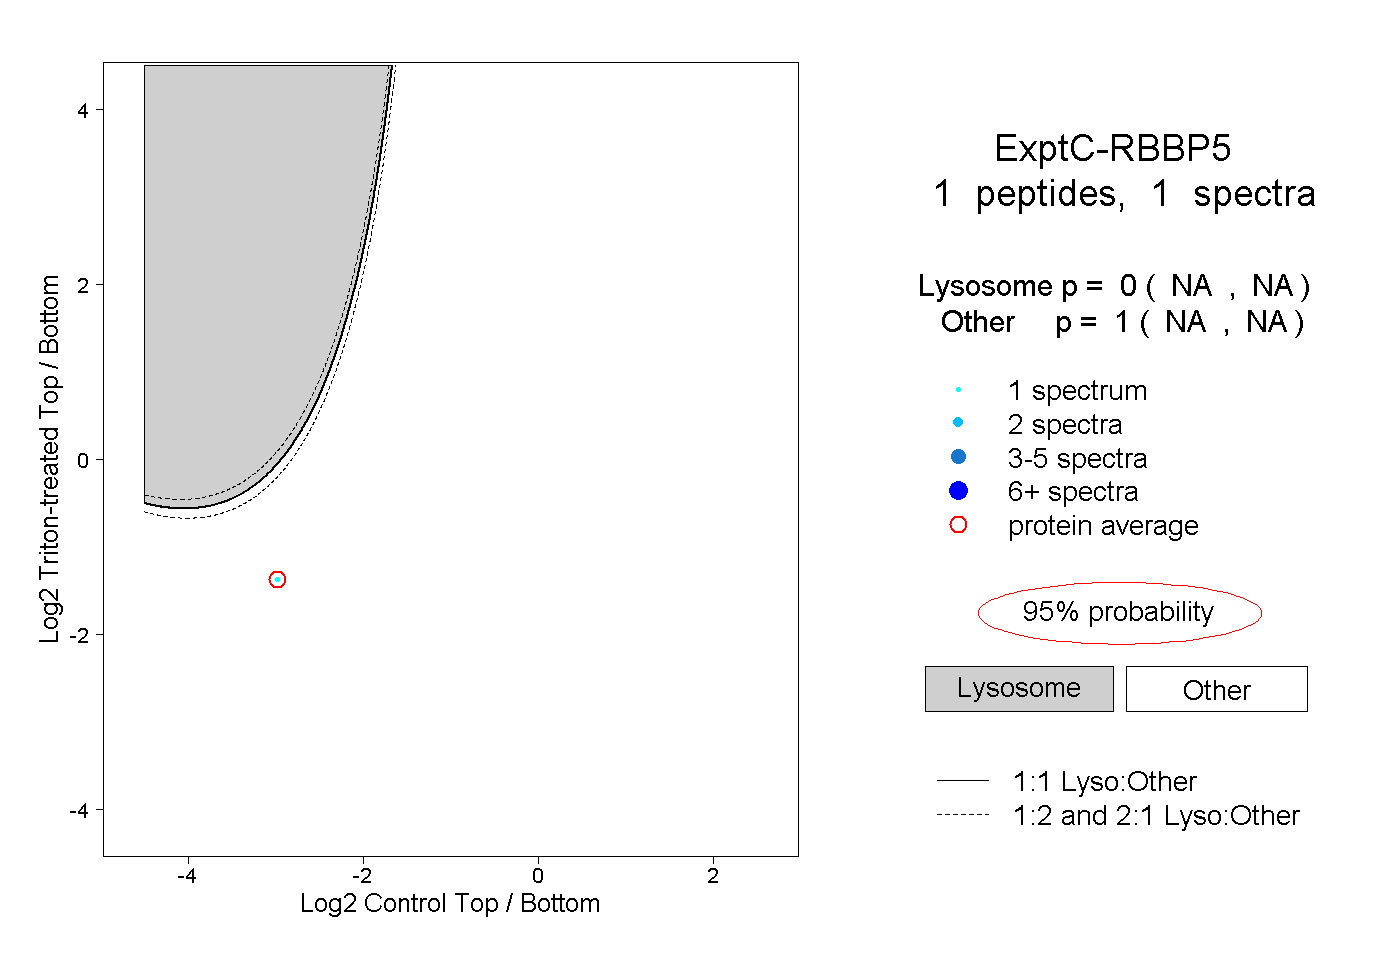 |
0.000 NA | NA |
1.000 NA | NA |
||||||||
| Plot | Lyso | Other | |||||||||||
| Expt D |
1 peptide |
1 spectrum |
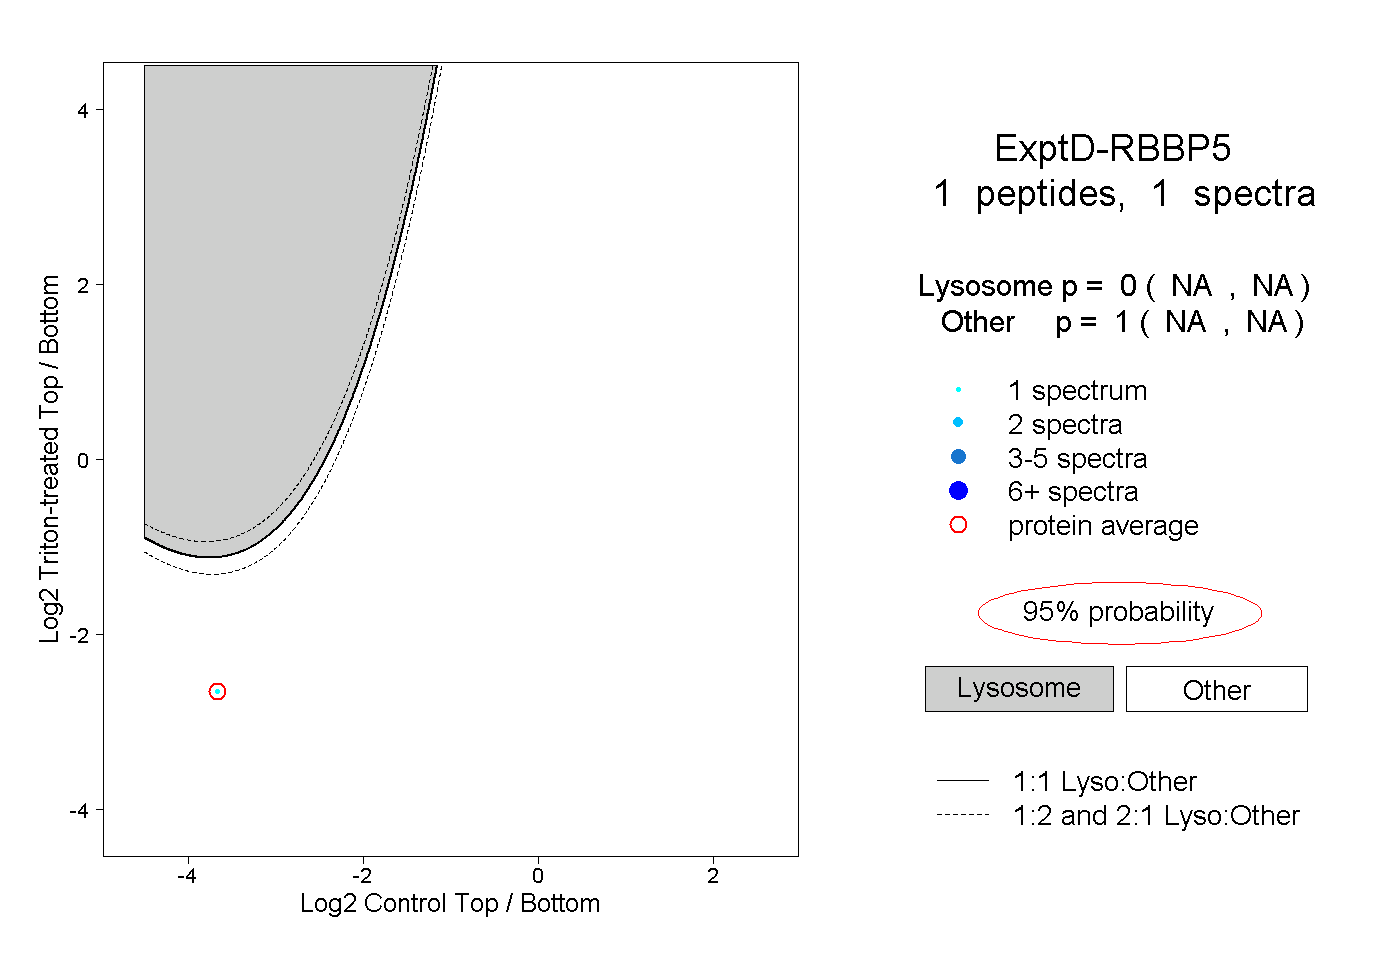 |
0.000 NA | NA |
1.000 NA | NA |