 6
6peptides
spectra
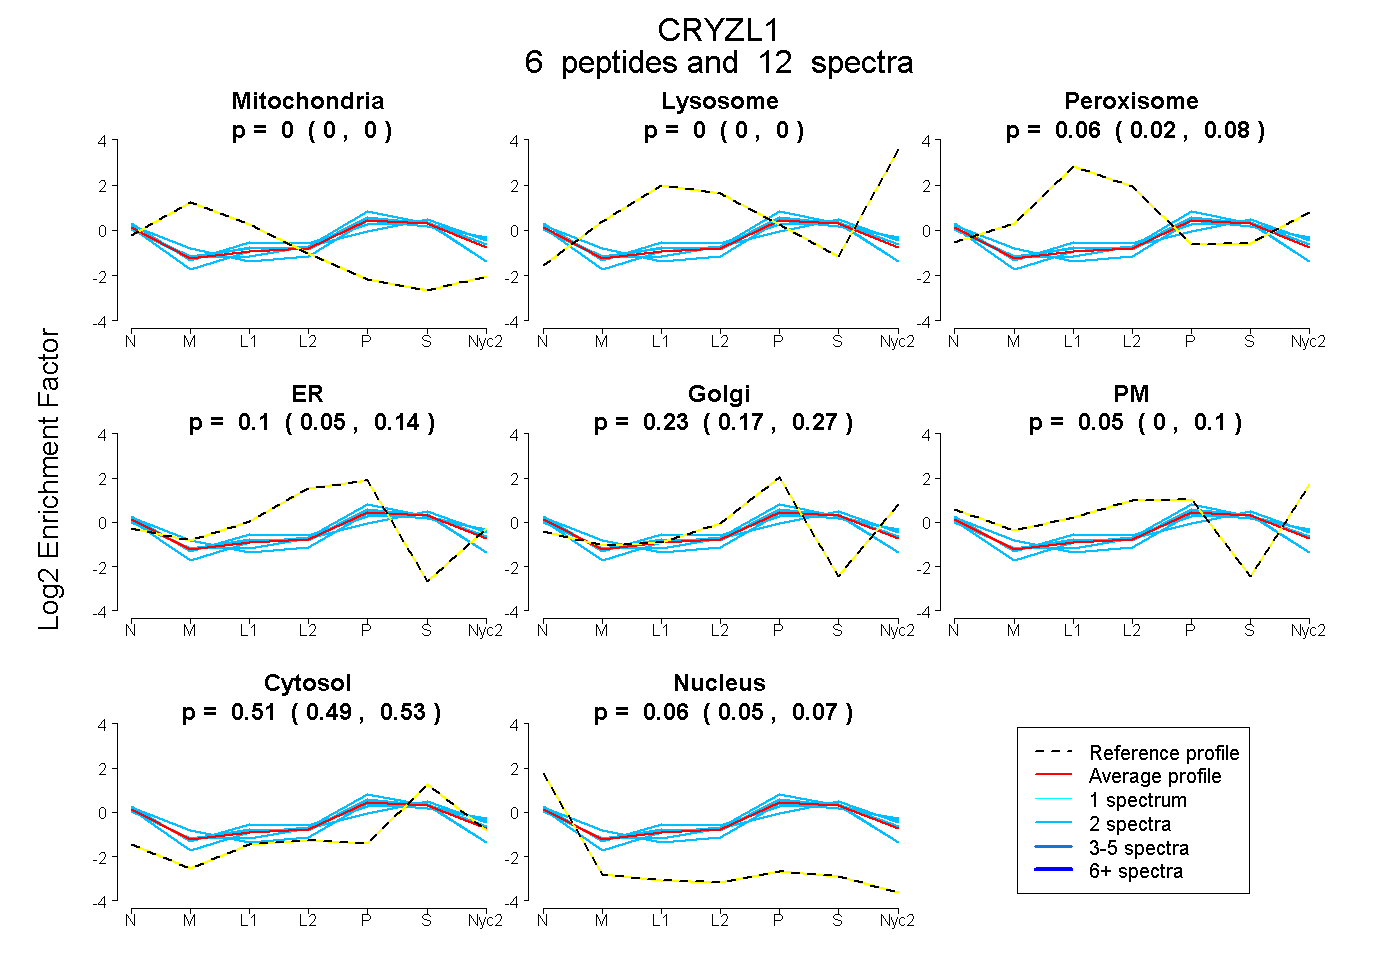
0.000 | 0.000
0.000 | 0.000
0.022 | 0.085
0.050 | 0.135
0.165 | 0.271
0.000 | 0.099
0.491 | 0.531
0.047 | 0.070
1peptide
spectrum

NA | NA
NA | NA
NA | NA
NA | NA
NA | NA
NA | NA
NA | NA
6peptides
spectra
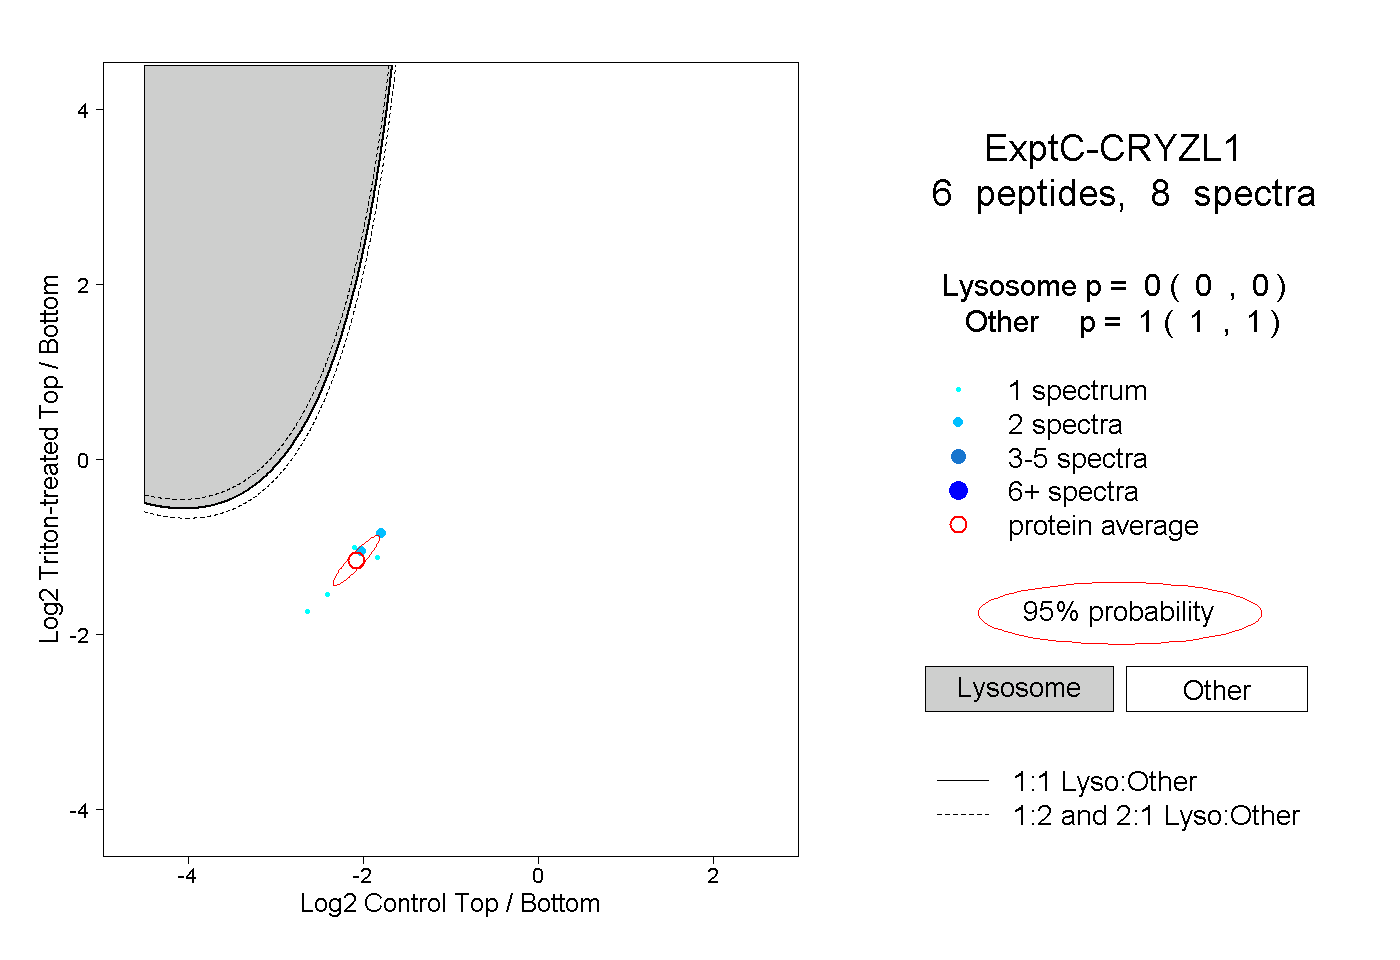
0.000 | 0.000
1.000 | 1.000