 6
6peptides
spectra
0.000 | 0.000
0.000 | 0.000
0.022 | 0.085
0.050 | 0.135
0.165 | 0.271
0.000 | 0.099
0.491 | 0.531
0.047 | 0.070
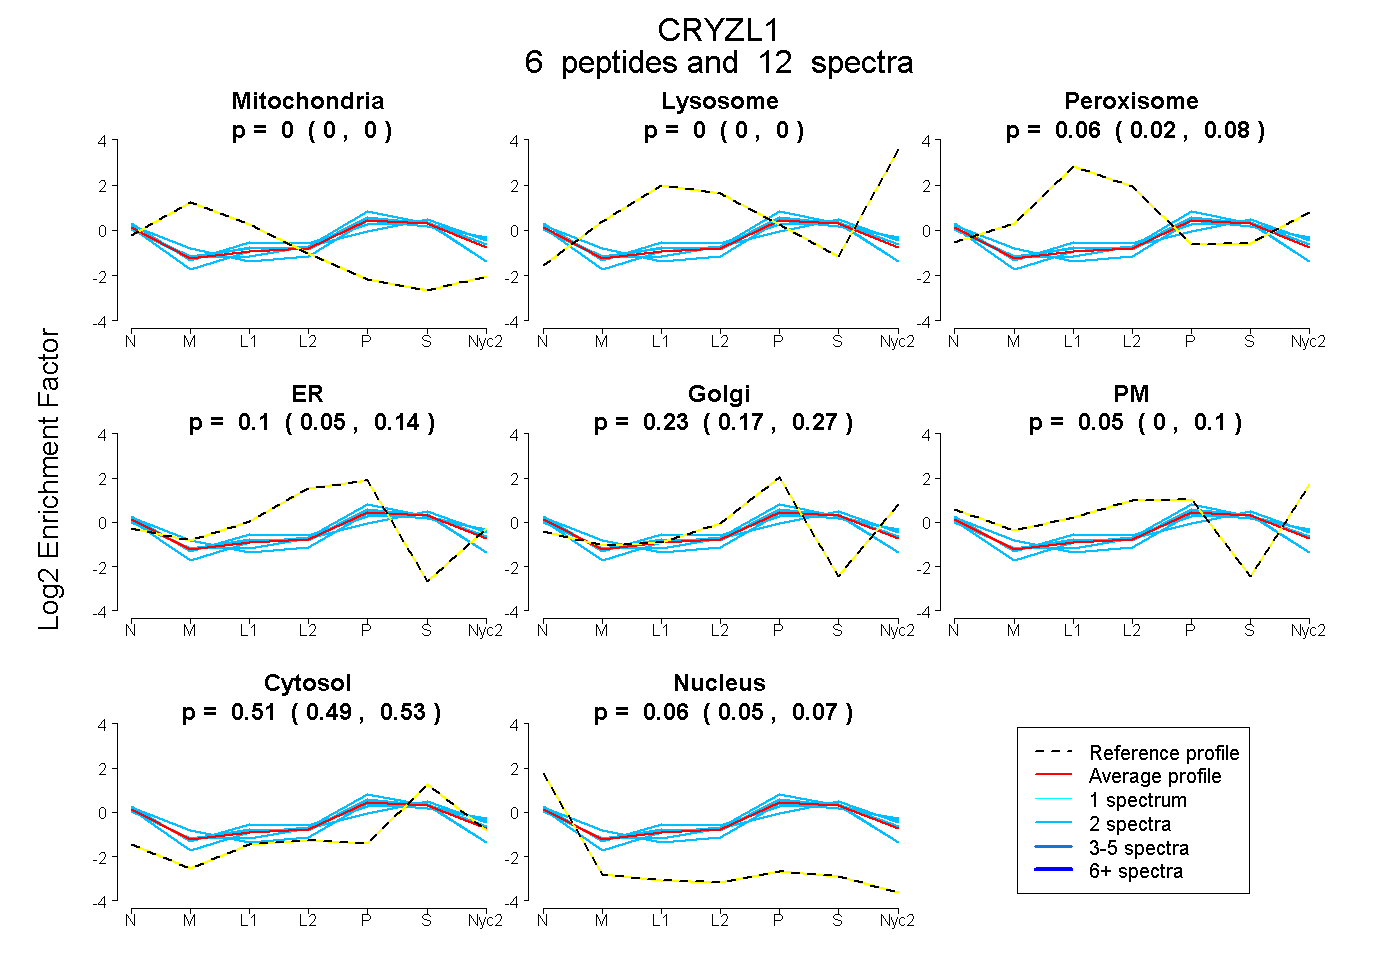
| Plot | Mito | Lyso | Perox | ER | Golgi | PM | Cytosol | Nucleus | |||||
| Expt A |
6 peptides |
12 spectra |
|
0.000 0.000 | 0.000 |
0.000 0.000 | 0.000 |
0.059 0.022 | 0.085 |
0.096 0.050 | 0.135 |
0.227 0.165 | 0.271 |
0.047 0.000 | 0.099 |
0.511 0.491 | 0.531 |
0.060 0.047 | 0.070 |
| 2 spectra, YLCILK | 0.000 | 0.000 | 0.113 | 0.289 | 0.000 | 0.000 | 0.486 | 0.113 | ||
| 2 spectra, QQLPHK | 0.035 | 0.000 | 0.000 | 0.347 | 0.027 | 0.000 | 0.536 | 0.054 | ||
| 2 spectra, ACALSHINTK | 0.000 | 0.000 | 0.107 | 0.026 | 0.332 | 0.000 | 0.483 | 0.052 | ||
| 2 spectra, LRPSLAR | 0.019 | 0.000 | 0.000 | 0.002 | 0.066 | 0.274 | 0.610 | 0.029 | ||
| 2 spectra, EFFPVGR | 0.047 | 0.000 | 0.000 | 0.000 | 0.311 | 0.119 | 0.479 | 0.044 | ||
| 2 spectra, LLAEMK | 0.000 | 0.000 | 0.000 | 0.065 | 0.329 | 0.073 | 0.533 | 0.000 |
| Plot | Mito | Lyso or Perox | ER | Golgi | PM | Cytosol | Nucleus | ||||||
| Expt B |
1 peptide |
1 spectrum |
 |
0.000 NA | NA |
0.163 NA | NA |
0.000 NA | NA |
0.278 NA | NA |
0.199 NA | NA |
0.360 NA | NA |
0.000 NA | NA |
|||
| Plot | Lyso | Other | |||||||||||
| Expt C |
6 peptides |
8 spectra |
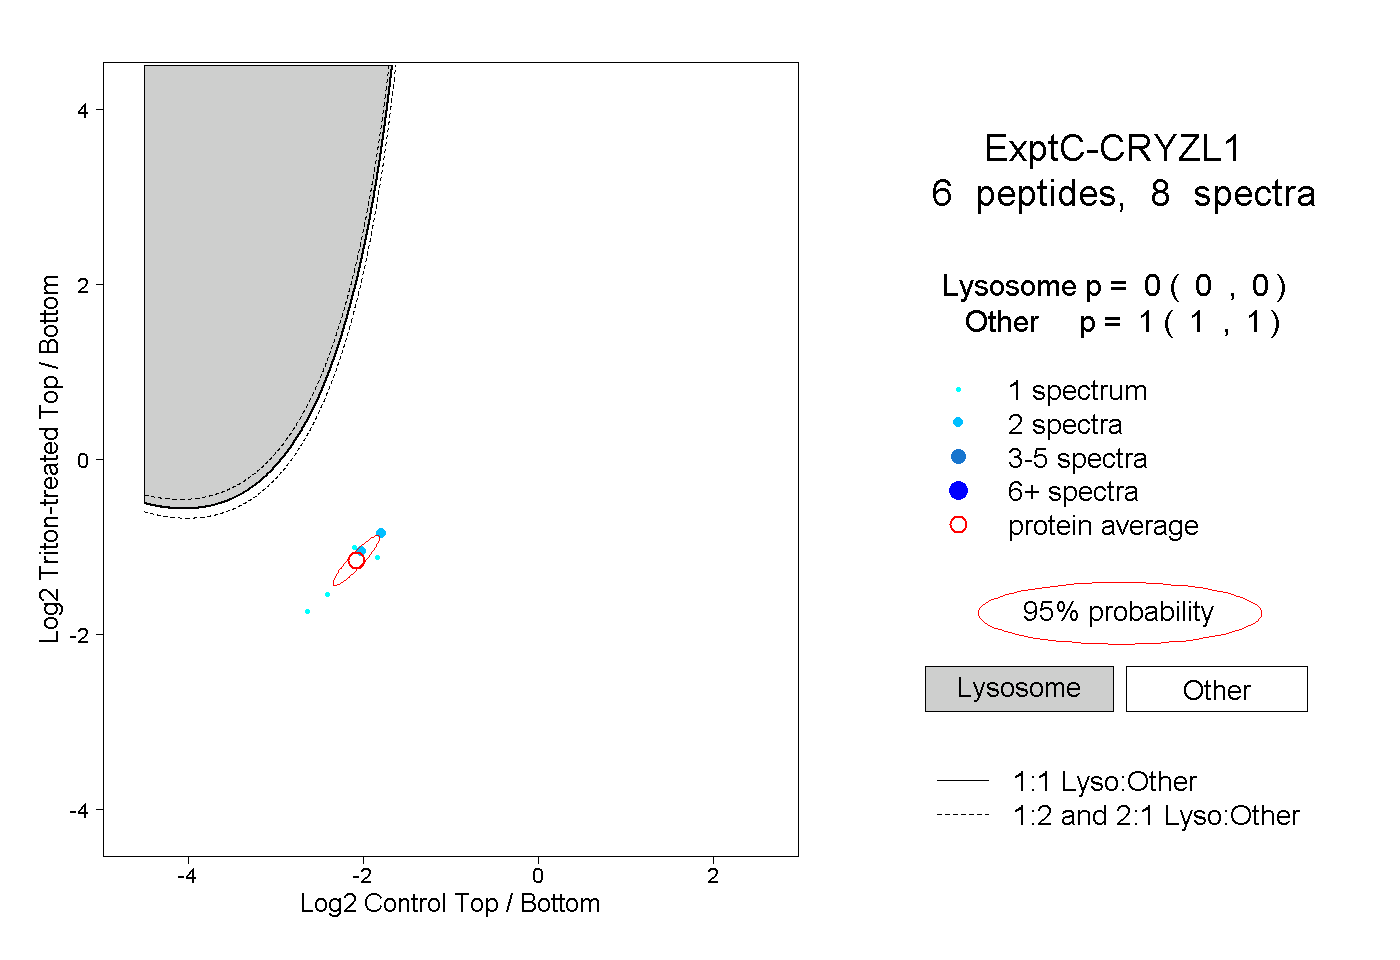 |
0.000 0.000 | 0.000 |
1.000 1.000 | 1.000 |